. 2013 Jun 12;10(85):20130325.
doi: 10.1098/rsif.2013.0325. Print 2013 Aug 6.

Age-dependent stochastic models for understanding population fluctuations in continuously cultured cells

Affiliations

Age-dependent stochastic models for understanding population fluctuations in continuously cultured cells

Evgeny B Stukalin et al. J R Soc Interface. .

Abstract

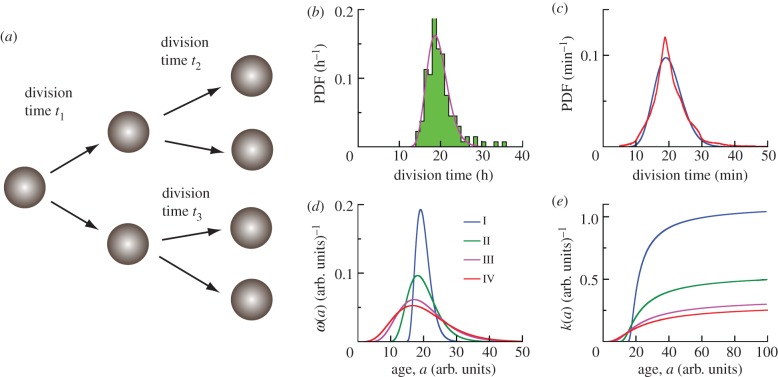
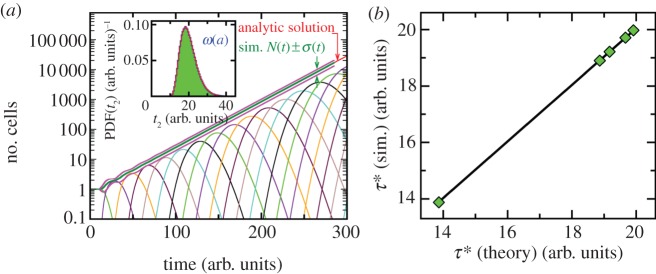
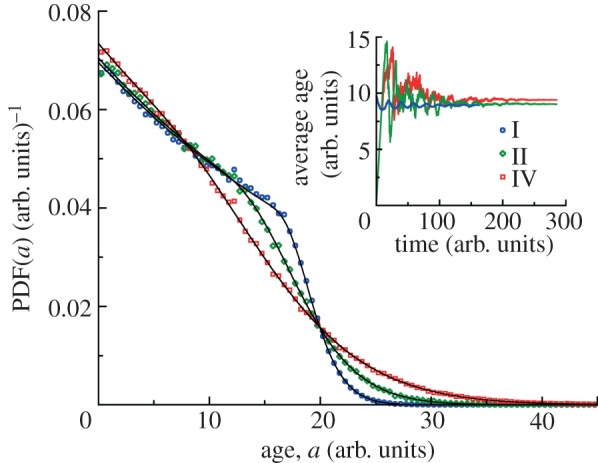
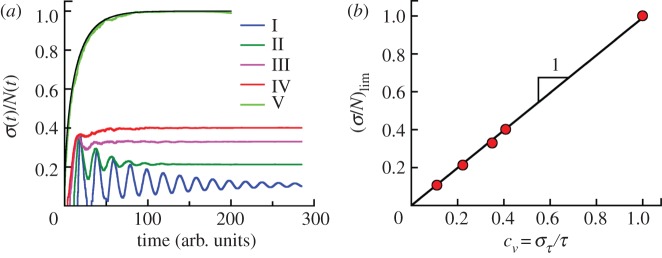
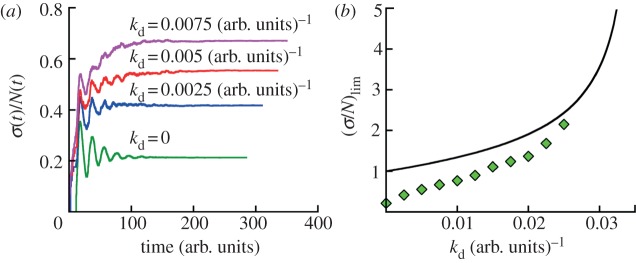
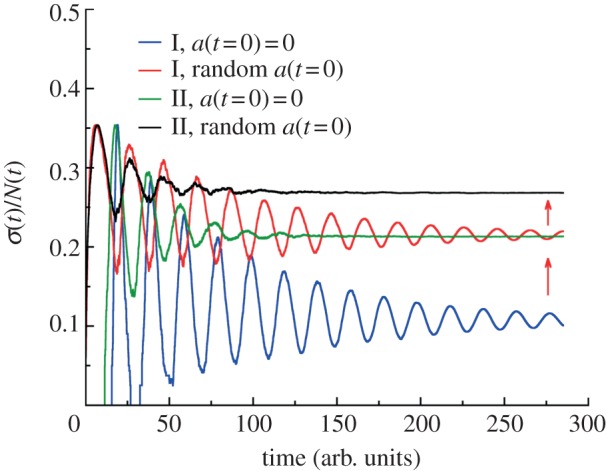
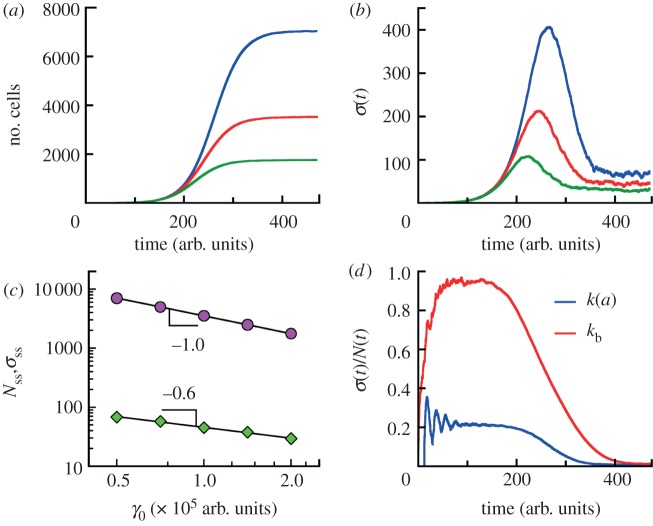
For symmetrically dividing cells, large variations in the cell cycle time are typical, even among clonal cells. The consequence of this variation is important in stem cell differentiation, tissue and organ size control, and cancer development, where cell division rates ultimately determine the cell population. We explore the connection between cell cycle time variation and population-level fluctuations using simple stochastic models. We find that standard population models with constant division and death rates fail to predict the level of population fluctuation. Instead, variations in the cell division time contribute to population fluctuations. An age-dependent birth and death model allows us to compute the mean squared fluctuation or the population dispersion as a function of time. This dispersion grows exponentially with time, but scales with the population. We also find a relationship between the dispersion and the cell cycle time distribution for synchronized cell populations. The model can easily be generalized to study populations involving cell differentiation and competitive growth situations.

Keywords: cell cycle variation; evolutionary models; stochastic population dynamics.


Figures

Figure 1.
Figure 1.
Cell age and division time distributions. (a) For symmetrically dividing cells, the time between cell divisions is stochastic, and can be described by a probability distribution function (PDF). (b) Histogram of division time distribution for human dermal fibroblast cells studied in the present work (133 cells). The average division time is τ = 19.8 h. The solid line represents the fit by the shifted gamma distribution with parameters α = 12.5, β = 0.72 h and a0 = 10.4 h. (c) Division time distribution for E. coli, MG1655 strain (22 959 cells) with τ = 21.4 min and σ = 5.4 min from Wang et al. [1] shown by red line. Blue line is the best fit by the shifted gamma distribution with parameters α = 22.9, β = 0.87 min and a0 = 0 min with τfit = 20.0 min and σfit = 4.2 min. (d) Theoretical generation time distributions ω(a) studied in the present work are described by shifted gamma distributions with parameters α = 6 (I–IV), and β = 0.91, 1.82, 2.86, 3.33 arb. units, and a0 = 14.55, 9.09, 2.86, 0 arb. units for I, II, III, IV, respectively (see equation (2.17)). The average generation time for distributions I–IV is the same τ = 20 arb. units. (e) The function k(a) is the probability per unit time that a cell divides into two new cells for theoretical distributions of generation times I–IV (see legends in (d)). The asymptotic value of k(a) is 1/β (arb. units)–1.
Figure 2.
Figure 2.
Growth of a clonal cell colony using age-dependent stochastic model. (a) The average number of cells, N(t), grown from a single cell of age a = 0 (synchronized initial condition) for division time distribution II is shown from 1000 simulations (thick green line). Magenta lines represent N(t) plus and minus the standard deviation σ(t). The red line is the analytical solution of the von Foerster equation for synchronized populations. The thin curves (with maxima) represent the contributions from different generations (see the electronic supplementary material, section B). The results of our simulations are in excellent agreement with analytic solution. The inset depicts the probability density function of division times obtained from simulations (106 runs) for the theoretical division time distribution II (see caption to figure 1d). Our simulation recovers the original division time distribution ω(a) (red line). (b) the computed average doubling times compared to the theoretical result of equation (2.12) for division time distributions (I–IV) and the exponential distribution (V). There is complete agreement between the theoretical prediction and our simulation.
Figure 3.
Figure 3.
Steady-state age distributions for clonal colonies. Age distributions for division time distributions I, II and IV (τ = 20 arb. units, see caption to figure 1d) are obtained from simulations. Each distribution is obtained by analysing 25 growth trajectories with final ages recorded at the end of each run. For distributions II and IV the populations are grown from a single cell of a = 0 and the final ages are analysed at t = 285 arb. units. For the narrow distribution I, the initial number of cells is 200 for each run with uniform initial age distribution between 0 and a = 20 arb. units. The final ages are analysed at t = 160 arb. units. The solid black lines represent theoretical results of the long time ansatz in equation (2.15). The inset depicts the convergence of the average age of cells in the growing population to a constant value at long times. The average ages of cells for distributions I, II and IV are 8.94, 9.02 and 9.40 arb. units, respectively, are in agreement with theoretical values for the same distributions.
Figure 4.
Figure 4.
Population fluctuations in growing clonal colonies with initially synchronized population. (a) The average relative population fluctuations in clones grown from a single cell (N0 = 1) with no cell death. σ(t) is defined in equation (3.3). The fluctuations depend on the division time distribution. Curves I–IV are for ω(a) in figure 1d. Curve V corresponds to exponential distribution of division times (i.e. constant division rate). The relative fluctuations reach constant values for long times. (b) The asymptotic values of the relative population fluctuations of synchronized cell populations (σ/N)lim at long times for theoretical distributions I–V taken from figure 4a are shown as a function of coefficient of variation of generation times cv defined by equation (3.2). The solid line represents the linear fit (σ/N)lim = bσcv with bσ = 0.99 ± 0.01. The condition of synchronized populations at t = 0 is essential to observe this simple relation between (σ/N)lim and cv for age-dependent cell division probability per unit time (cases I–IV) but does not matter for constant cell division rate (case V). The coefficients of variation for theoretical distributions I–V by equation (3.2) are cv = 0.111, 0.222, 0.350, 0.408 and 1, respectively.
Figure 5.
Figure 5.
Effect of cell death on cell population fluctuations. (a) A constant cell death rate always increases the relative population fluctuation. The bottom line is the simulation result with no cell death taken from figure 4 (generation time distribution II, see caption to figure 1d). The other curves are for cell death rates kd = 0.0025, 0.005 and 0.0075 (arb. units.)−1, respectively. σ(t) and N(t) are obtained at least for 200 runs for all cases. The populations are grown from a single cell of the zero age a = 0. The respective growth curves from simulations for some kd are presented in electronic supplementary material, figure S5 of SI. (b) Asymptotic values of (σ/N)lim are shown as a function of cell death rate kd. The symbols are simulation data for age-dependent cell division k(a) (generation time distribution II) and constant cell death kd obtained by analysing at least 200 runs for each case. The black line represents theoretical dependence for both contant rates kb and kd given by equation (S9) in electronic supplementary material, section A.
Figure 6.
Figure 6.
Effect of initial age distribution on population fluctuations. The growth of cell populations is simulated from a single cell for generation time distributions I and II (see legends and caption to figure 1d). For synchronized populations the initial age of a starting cell is taken to be zero. For asynchronous growth the initial age of a cell is chosen randomly from 0 to τ. The red arrows show increasing the asymptotic values of relative dispersions for asynchronous growth compared with synchronized condition. The effect of initial age distribution on (σ/N)lim is greater for less dispersed generation time distribution (I verus II) and is absent for constant cell division rate.
Figure 7.
Figure 7.
Competitive growth. (a) The average numbers of cells as functions of time for competitive populations with age-dependent cell division rate k(a) (distribution II, see caption to figure 1d) and death rates proportional to the number of other individuals γ = γ0(n − 1). The populations are grown from a single cell of the zero age a = 0. The numbers of cells reach the steady state Nss at long times. The data for each γ0 are obtained from simulations for 120 growth trajectories. (b) The standard deviations σ(t) of the mean sizes of competitive populations from data in (a) are non-monotonic functions of time. At long times, σ(t) approach the limiting values σss in contrast to exponentially growing populations. The population size distributions at steady state are stationary Gaussian around mean sizes Nss (see the electronic supplementary material, figure S9 of SI). (c) The average numbers of cell Nss (circles) and its standard deviations σss (diamonds) at steady state are shown as a function of ‘competitive’ cell death rate γ0. The data are analysed in the time interval from t = 400 arb. units to t = 474 arb. units for all values of γ0. The mean population is inversely proportional to γ0. (d) Comparison of the population fluctuation for age-dependent (blue) and age-independent (constant division rate kb) (red) models. γ0 for these models are identical. Parameters are chosen so that the average growth rates in the absence of cell death are identical. The age-dependent model shows a significantly different behaviour.

References

    1. Wang P, Robert L, Pelletier J, Dang WL, Taddei F, Wright A, Jun S. 2010. Robust growth of Escherichia coli. Curr. Biol. 20, 1099–110310.1016/j.cub.2010.04.045 (doi:10.1016/j.cub.2010.04.045) - DOI - DOI - PMC - PubMed
    1. Tzur A, Kafri R, LeBleu VS, Lahav G, Kirschner MW. 2009. Cell growth and size homeostasis in proliferating animal cells. Science 325, 167–17110.1126/science.1174294 (doi:10.1126/science.1174294) - DOI - DOI - PMC - PubMed
    1. Halter M, Elliott JT, Hubbard JB, Tona A, Plant AL. 2009. Cell colume distributions reveal cell growth and division times. J. Theor. Biol. 257, 124–13010.1016/j.jtbi.2008.10.031 (doi:10.1016/j.jtbi.2008.10.031) - DOI - DOI - PubMed
    1. Scott M, Gunderson CW, Mateescu EM, Zhang Z, Hwa T. 2010. Interdependence of cell growth and gene expression: origins and consequences. Science 330, 1099–110210.1126/science.1192588 (doi:10.1126/science.1192588) - DOI - DOI - PubMed
    1. Sun Z, Komarova NL. 2012. Stochastic modeling of stem-cell dynamics with control. Math. Biosci. 240, 231–24010.1016/j.mbs.2012.08.004 (doi:10.1016/j.mbs.2012.08.004) - DOI - DOI - PMC - PubMed

Publication types

LinkOut - more resources