. 2013 Sep;21(9):1758-66.
doi: 10.1038/mt.2013.145. Epub 2013 Jun 13.

Endothelial differentiation of adipose tissue-derived mesenchymal stromal cells in glioma tumors: implications for cell-based therapy

Affiliations

Endothelial differentiation of adipose tissue-derived mesenchymal stromal cells in glioma tumors: implications for cell-based therapy

Juli R Bagó et al. Mol Ther. 2013 Sep.

Abstract

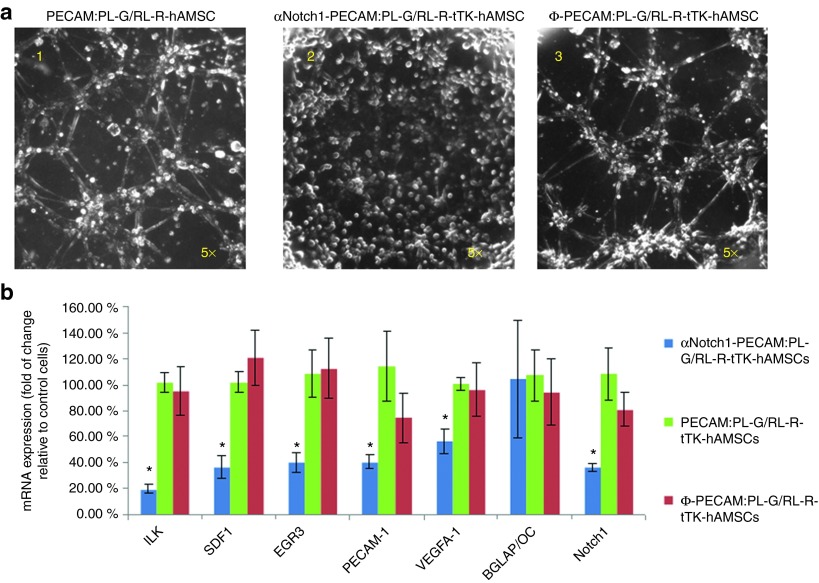
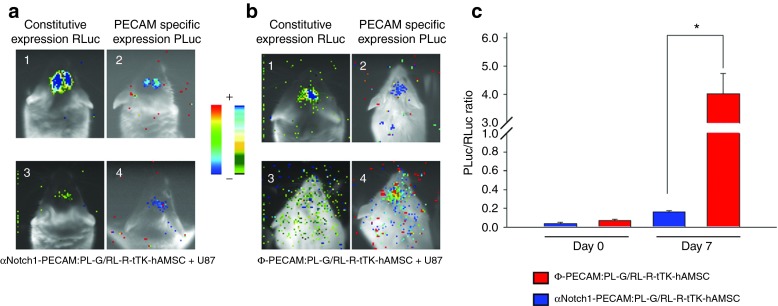
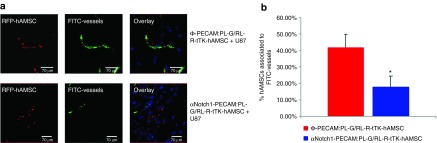
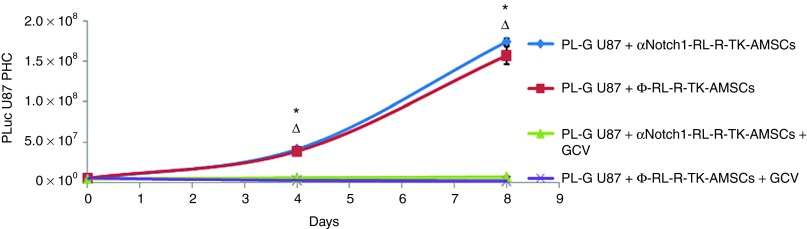
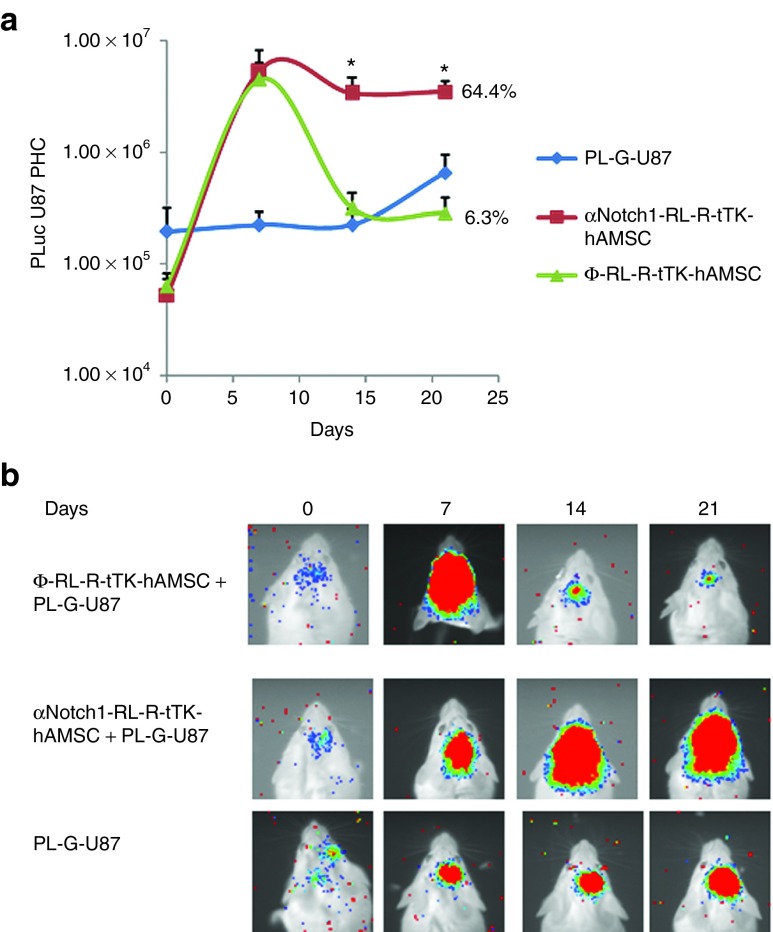
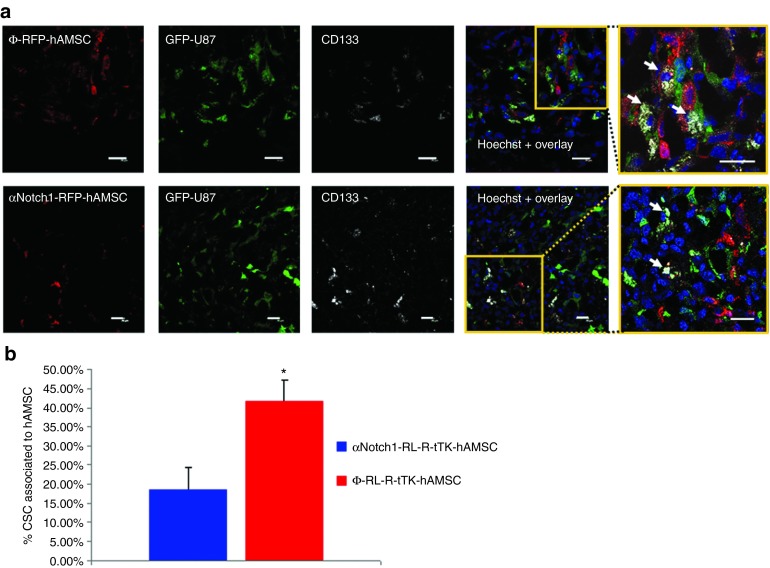
Multipotent human adipose tissue mesenchymal stromal cells (hAMSCs) are promising therapy vehicles with tumor-homing capacity that can be easily modified to deliver cytotoxicity activating systems in the proximity of tumors. In a previous work, we observed that hAMSCs are very effective delivering cytotoxicity to glioma tumors. However, these results were difficult to reconcile with the relatively few hAMSCs surviving implantation. We use a bioluminescence imaging (BLI) platform to analyze the behavior of bioluminescent hAMSCs expressing HSV-tTK in a U87 glioma model and gain insight into the therapeutic mechanisms. Tumor-implanted hAMSCs express the endothelial marker PECAM1(CD31), integrate in tumor vessels and associate with CD133-expressing glioma stem cells (GSC). Inhibition of endothelial lineage differentiation in hAMSCs by Notch1 shRNA had no effect on their tumor homing and growth-promoting capacity but abolished the association of hAMSCs with tumor vessels and CD133+ tumor cells and significantly reduced their tumor-killing capacity. The current strategy allowed the study of tumor/stroma interactions, showed that tumor promotion and tumor-killing capacities of hAMSCs are based on different mechanisms. Our data strongly suggest that the therapeutic effectiveness of hAMSCs results from their association with special tumor vascular structures that also contain GSCs.


Figures

Figure 1
Figure 1
In vitro tube formation by hAMSC requires Notch1 expression. Phase contrast photomicrographs (a) of untransduced (left); αNotch1 shRNA transduced (middle) and mock ΦshRNA transduced (right) PECAM:PL-G/RL-R-tTK-hAMSCs incubated in Matrigel for 4 hours. (b) RNA extracted from cells in matrigel was assayed by RT-PCR to determine transcription the levels of the indicated endothelial (ILK, SDF1, EGR3,PECAM-1, VEGFA-1, Notch-1) and bone BGLAP/Octeocalcin differentiation markers. The histogram shows % fold change relative to the control un-transduced PECAM:PL-G/RL-R-tTK-hAMSCs. *P < 0.05; n = 3.
Figure 2
Figure 2
Endothelial differentiation of hAMSCs in U87 glioma tumors requires Notch1 expression. hAMSCs expressing PECAM-promoter regulated PLuc-GFP and CMV-promoter regulated RL-R-tTK were transduced with either αNotch1 shRNA or a mock ΦshRNA to produce αNotch1-PECAM:PL-G/RL-R-tTK-hAMSCs and control Φ-PECAM:PL-G/RL-R-tTK-hAMSCs, respectively. Independent mixtures comprising unlabeled U87 glioma cells and one of the above cell types in a ratio of 1:4 (U87:hAMSC) were implanted at specific brain coordinates and imaged to determine cell number and distribution (a1,3; b1,3), or differentiation to the endothelial lineage (a2,4 and b2,4) by BLI of Renilla and Photinus luciferases, respectively. Pseudocolor images are superimposed on black and white dorsal images of recipient mice. Color bars illustrate relative light intensities of PLuc (right) and RLuc (left); low: blue and black; high: red and blue, respectively. The ratio between photons acquired from Photinus luciferase and Renilla luciferase generated images (PLuc/RLuc) was used to evaluate differentiation of implanted cells to the endothelial lineage (c). *P < 0.05; n = 4.
Figure 3
Figure 3
Association of hAMSCs with tumor microvessels is Notch1 dependent. Representative laser confocal microscope images of slices from brain tumors implanted with αNotch1-PECAM:PL-G/RL-R-tTK-hAMSCs or control Φ-PECAM:PL-G/RL-R-tTK-hAMSCs. (a) Microphotographs show the location of RFP expressing control Φ-PECAM:PL-G/RL-R-tTK-hAMSCs (top) and inhibited αNotch1-PECAM:PL-G/RL-R-tTK-hAMSCs (bottom) relative to FITC-labeled microvessel (gree). (b) Histogram representing the percentage of red hAMSCs associated to FITC-labeled microvessel for Φ-PECAM:PL-G/RL-R-tTK-hAMSCs and αNotch1-PECAM:PL-G/RL-R-tTK-hAMSCs. Bars represent mean ± SEM of percent values. *P < 0.05; n = 25 (tumor slices analyzed).
Figure 4
Figure 4
Expression of TK cytotoxicity is independent of Notch1 expression. PL-G-U87cells were grown during the indicated times in combination with either Φ-RL-R-tTK-hAMSCs or αNotch1-RL-R-tTK-hAMSCs in a 5:1 proportion, and treated with GCV (4 μg/ml), as indicated. Cell viability was evaluated by quantification of luciferase activity by BLI at the indicated times, and expressed as PL-G-U87 PHCs. The graph shows mean ± SEM, *P < 0.01 Φ-RL-R-tTK-hAMSCs+GCV-treated group versus Φ-RL-tTK-hAMSC control group, ΔP < 0.01 αNotch1-RL-R-tTK-hAMSCs+GCV-treated group versus αNotch1-RL-R-tTK-hAMSC control group, n = 3 for each group.
Figure 5
Figure 5
Delivery of cytotoxicity by HAMSC to U87 gliomas in vivo is Notch1 dependent. Glioma PL-G-U87 cells (4 × 104) mixed with either αNotch1-RL-R-tTK-hAMSCs or Φ-RL-R-tTK-hAMSCs (1.6 × 106), or no-hAMSCs, were implanted (methods) in the brain of mice, and at day 7 p.i. a daily GCV treatment (100 mg/kg) was initiated. Tumor growth was monitored at implantation day and every 7 days thereafter. (a) The graph shows changes in tumor generated luciferase activity calculated from the recorded images, represented as log10 mean ± SEM. *P < 0.05; n = 8. (b) Composite pseudo-color BLI images from representative mice.
Figure 6
Figure 6
Co-localization of hAMSCs and U87 cancer stem cells in gliomas. (a) Tumors generated by implanting 4 × 104 PL-G-U87 cells and either 1.6 × 105 Φ-RL-R-tTK-hAMSCs (top row) or the same number of αNotch1-RL-R-tTK-hAMSCs (bottom row) were excised after one week of growth, sectioned and incubated with an anti-human-CD133 ab. Representative laser scanning confocal microscope images show hAMSCs (red fluorescent), U87 glioma cells (green fluorescent) and CD133+ GSCs (grey). Hoechst nuclear stain in blue. Insets are higher magnification images corresponding to the boxed regions in merged images emphasizing interactions between CD133+ GSCs (white arrows) and hAMSCs; Scale bar= 20 μm. (b) Histogram representing the percentage of PL-G-U87 GSCs associated to hAMSC in the case of Φ-RL-R-tTK-hAMSCs and αNotch1-RL-R-tTK-hAMSCs. Bars represent mean ± SEM of percent values. *P < 0.05; n = 15.

References

    1. Argyriou AA, Kalofonos HP. Molecularly targeted therapies for malignant gliomas. Mol Med. 2009;15:115–122. - PMC - PubMed
    1. Buckner JC, Brown PD, O'Neill BP, Meyer FB, Wetmore CJ, Uhm JH. Central nervous system tumors. Mayo Clin Proc. 2007;82:1271–1286. - PubMed
    1. Castro MG, Cowen R, Williamson IK, David A, Jimenez-Dalmaroni MJ, Yuan X, et al. Current and future strategies for the treatment of malignant brain tumors. Pharmacol Ther. 2003;98:71–108. - PubMed
    1. Winkler F, Kienast Y, Fuhrmann M, Von Baumgarten L, Burgold S, Mitteregger G, et al. Imaging glioma cell invasion in vivo reveals mechanisms of dissemination and peritumoral angiogenesis. Glia. 2009;57:1306–1315. - PubMed
    1. Amberger-Murphy V. Hypoxia helps glioma to fight therapy. Curr Cancer Drug Targets. 2009;9:381–390. - PubMed

Publication types

MeSH terms