. 2013 Jun 5:3:19.
doi: 10.3389/fcimb.2013.00019. eCollection 2013.

Actin-binding protein regulation by microRNAs as a novel microbial strategy to modulate phagocytosis by host cells: the case of N-Wasp and miR-142-3p

Affiliations

Actin-binding protein regulation by microRNAs as a novel microbial strategy to modulate phagocytosis by host cells: the case of N-Wasp and miR-142-3p

Paulo Bettencourt et al. Front Cell Infect Microbiol. .

Abstract

Mycobacterium tuberculosis (Mtb) is a successful intracellular pathogen that thrives in macrophages (Mφs). There is a need to better understand how Mtb alters cellular processes like phagolysosome biogenesis, a classical determinant of its pathogenesis. A central feature of this bacteria's strategy is the manipulation of Mφ actin. Here, we examined the role of microRNAs (miRNAs) as a potential mechanism in the regulation of actin-mediated events leading to phagocytosis in the context of mycobacteria infection. Given that non-virulent Mycobacterium smegmatis also controls actin filament assembly to prolong its intracellular survival inside host cells, we performed a global transcriptomic analysis to assess the modulation of miRNAs upon M. smegmatis infection of the murine Mφ cell line, J774A.1. This approach identified miR-142-3p as a key candidate to be involved in the regulation of actin dynamics required in phagocytosis. We unequivocally demonstrate that miR-142-3p targets N-Wasp, an actin-binding protein required during microbial challenge. A gain-of-function approach for miR-142-3p revealed a down-regulation of N-Wasp expression accompanied by a decrease of mycobacteria intake, while a loss-of-function approach yielded the reciprocal increase of the phagocytosis process. Equally important, we show Mtb induces the early expression of miR-142-3p and partially down-regulates N-Wasp protein levels in both the murine J774A.1 cell line and primary human Mφs. As proof of principle, the partial siRNA-mediated knock down of N-Wasp resulted in a decrease of Mtb intake by human Mφs, reflected in lower levels of colony-forming units (CFU) counts over time. We therefore propose the modulation of miRNAs as a novel strategy in mycobacterial infection to control factors involved in actin filament assembly and other early events of phagolysosome biogenesis.

Keywords: M. smegmatis; M. tuberculosis; N-Wasp; macrophage; miR-142-3p; miRNA; phagocytosis; tuberculosis.


Figures

Figure 1
Figure 1
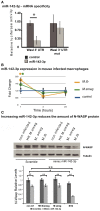
MicroRNA Expression in J774A.1 Macrophages infected with M. smegmatis for 1 h. (A) Heatmap of the most significantly regulated genes. The median normalized intensity values for each of the three infected replicates were divided by the median of the uninfected (wild type) samples. The ratio was then converted to log2 space and changes in the expression ratio were analysed using the Significance Analysis of Microarrays Test to isolate those with significant changes, FDR < 1%. (B) Relative expression of miR-142-3p in mouse cells infected with M. smegmatis at MOI 10, as measured by qPCR analysis. Data is represented as the mean fold change per sample ± SD at 1 and 4 h post-infection (*P ≤ 0.05).
Figure 2
Figure 2
N-Wasp is a target of miR-142-3p. (A) Luciferase assay showing the specific targeting of the 3′UTR of the mRNA of Wasl by the miR-142-3p. Data are represented as the mean fold change per sample ± SD (*P ≤ 0.01). (B) Relative expression of miR-142-3p in J774A.1 macrophages infected with M. smegmatis or M. tuberculosis (MOI 10), as measured by the EXIQON (DK) microRNA qPCR services. Data is represented as the mean fold change per sample ± SD at 1, 4, and 24 h post-infection (*P ≤ 0.05 relative to control). (C) Relative protein levels by western blot in J774A.1 macrophages transfected with mimics of miR-142-3p or not, and that of internalized mycobacteria (MOI 10) after a 1-h challenge. N-Wasp levels are relative to that of α/β-Tubulin. A representative blot from three independent experiments is shown with the densitometry quantification: quantification of the relative levels of N-Wasp in infected macrophages, treated with either mimics of miR-142-3p or scramble (*P ≤ 0.01; **P ≤ 0.001).
Figure 3
Figure 3
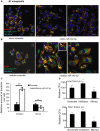
miR-142-3p activity correlates with a reduction of the amount of internalized M. smegmatis per Mφ. Confocal microscopy showing quantitative and qualitative analysis of J774A.1 macrophages treated with miR-142-3p mimics (A) or miR-142-3p inhibitors (B), and challenged with M. smegmatis (MOI 10) for 4 h. Arrows indicate phagocytic cups. Blue (DAPI), green (M. smegmatis GFP), and light red/orange (Rhodamine-Phalloidin). Bar: 20 μm. (C) Quantification of the relative amount of bacteria per macrophage treated with mimics or inhibitors of miR-142-3p. Data is represented as the mean area of bacteria per macrophage, per sample ± SEM at 4 h post infection (*P ≤ 0.05; **P ≤ 0.01). Data was analysed using ImageJ macros (http://www.formatex.info/microscopy4/614-621.pdf). (D) Colony forming units assay (CFU) of M. smegmatis-infected macrophages (MOI 0.1) either for 1 (top) or 4 (bottom) h, and under the treatment with mimics or inhibitors of miR-142-3p (*P ≤ 0.05).
Figure 4
Figure 4
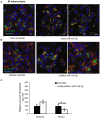
miR-142-3p activity correlates with a reduction of the amount of internalized M. tuberculosis per Mφ. Confocal microscopy showing quantitative and qualitative analysis of J774A.1 macrophages treated with miR-142-3p mimics (A) or miR-142-3p inhibitors (B), and challenged with M. tuberculosis (MOI 10) for 4 h. Blue (DAPI), green (H37Rv-eGFP), and Light red/orange (Rhodamine-Phalloidin). Bar: 20 μm. (C) Quantification of the relative amount of bacteria per macrophage treated with mimics or inhibitors of miR-142-3p. Data is represented as the mean area of bacteria per macrophage, per sample ± SEM at 4 h post infection (*P ≤ 0.05). Data was analysed using ImageJ macros (http://www.formatex.info/microscopy4/614-621.pdf).
Figure 5
Figure 5
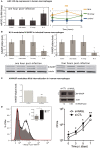
Expression of miR-142-3p and N-Wasp levels in infected human primary macrophages. (A) Left: relative expression of miR-142-3p under M. smegmatis, M. tuberculosis or latex beads, exposure (1 h) of macrophages, as measured by qPCR analysis. Right: relative expression of miR-142-3p in human macrophages infected with M. smegmatis or M. tuberculosis as the indicated time points, as measured by EXIQON (DK) microRNA qPCR services. (B) Relative protein levels by western blot analysis. N-Wasp levels relative to α/β-Tubulin either at 1 h post-infection with 20% reduction (upper left) or 4 h post-infection with 40% reduction (upper right). A representative blot (bottom) from three independent experiments is shown with densitometry quantification for each time point; data are represented as the mean fold change per sample ± SD (*P = 0.05). (C) The siRNA-mediated inactivation of N-Wasp (WASL) was performed as described in materials and method. Transfection of the siRNA SMARTpool targeting N-Wasp (si-WASL) resulted in an average of about 54% reduction of the protein level relative to that of the transfection with a non-targeting control siRNA pool (si-CTL). A representative western blot analysis (right) illustrates the gene inactivation obtained from four independent experiments (left); data are represented as the mean fold change relative to control sample (set arbitrarily at 1) ± SD (**P ≤ 0.01). (D) Left: phagocytosis of H37Rv-eGFP by human macrophages either inactivated for N-Wasp (si-WASL, gray) or transfected with the non-targeting siRNA pool (si-CLT, black), was analysed either by flow cytometry (histogram) analysis at MOI 10, or by CFU (inlet) assay at MOI 0.1, after 4 h of infection. Red indicates the fluorescence background of non-infected macrophages. The median fluorescence intensities (MFI) are as follow: 36 (non-infected), 117 (si-WASL) and 189 (si-CTL). Right: H37Rv-eGFP proliferation as measured by CFU analysis for different time points (days) for the same cellular conditions and donor as described for left panel. The data are representative of two independent experiments done in triplicates ± SD (*P = 0.05; **P = 0.01).

References

    1. Andreansky S., Liu H., Turner S., McCullers J. A., Lang R., Rutschman R., et al. (2005). WASP- mice exhibit defective immune responses to influenza A virus, Streptococcus pneumoniae, and Mycobacterium bovis BCG. Exp. Hematol. 33, 443–451 10.1016/j.exphem.2004.12.006 - DOI - PubMed
    1. Anes E., Kühnel M. P., Bos E., Moniz-Pereira J., Habermann A., Griffiths G. (2003). Selected lipids activate phagosome actin assembly and maturation resulting in killing of pathogenic mycobacteria. Nat. Cell Biol. 5, 793–802 10.1038/ncb1036 - DOI - PubMed
    1. Anes E., Peyron P., Staali L., Jordao L., Gutierrez M. G., Kress H., et al. (2006). Dynamic life and death interactions between Mycobacterium smegmatis and J774 macrophages. Cell. Microbiol. 8, 939–960 10.1111/j.1462-5822.2005.00675.x - DOI - PubMed
    1. Bellon M., Lepelletier Y., Hermine O., Nicot C. (2009). Deregulation of microRNA involved in hematopoiesis and the immune response in HTLV-I adult T-cell leukemia. Blood 113, 4914–4917 10.1182/blood-2008-11-189845 - DOI - PMC - PubMed
    1. Betel D., Wilson M., Gabow A., Marks D. S., Sander C. (2008). The microRNA.org resource: targets and expression. Nucleic Acids Res. 36, D149–D153 10.1093/nar/gkm995 - DOI - PMC - PubMed

Publication types

MeSH terms