. 2013 Aug;24(15):2419-30.
doi: 10.1091/mbc.E13-03-0126. Epub 2013 Jun 12.

A light-inducible organelle-targeting system for dynamically activating and inactivating signaling in budding yeast

Affiliations

A light-inducible organelle-targeting system for dynamically activating and inactivating signaling in budding yeast

Xiaojing Yang et al. Mol Biol Cell. 2013 Aug.

Abstract

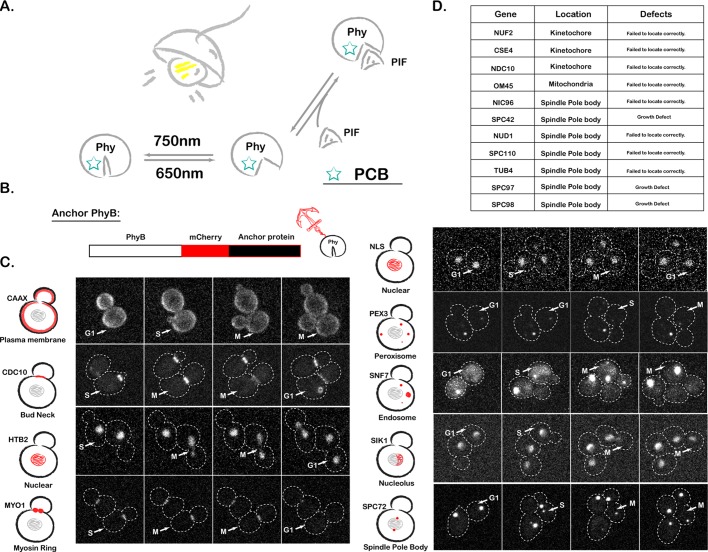
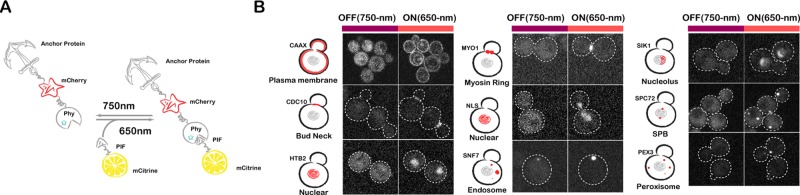
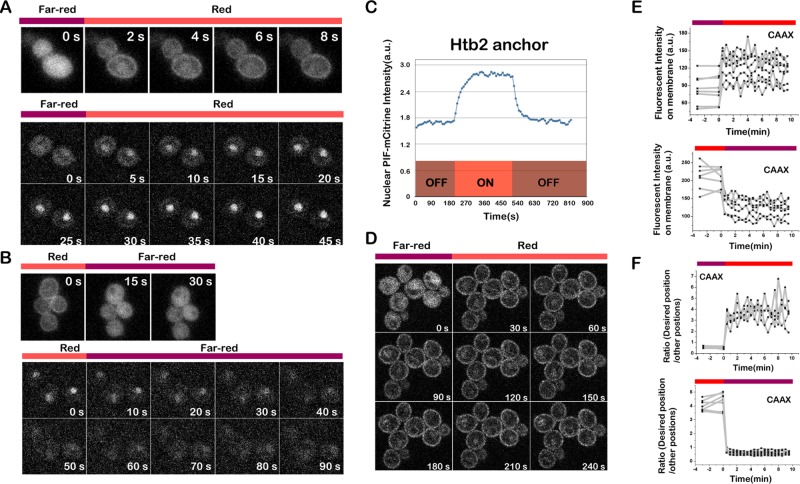
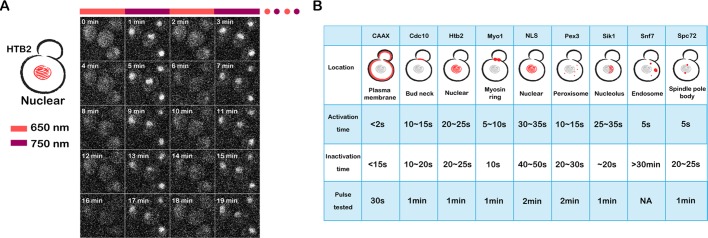
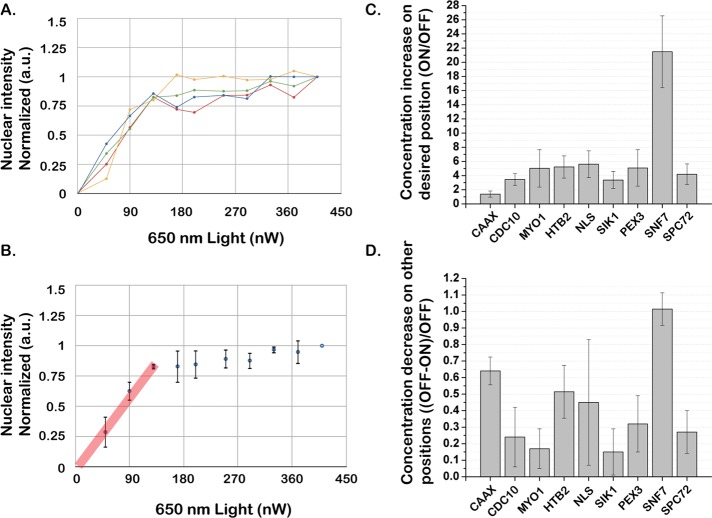
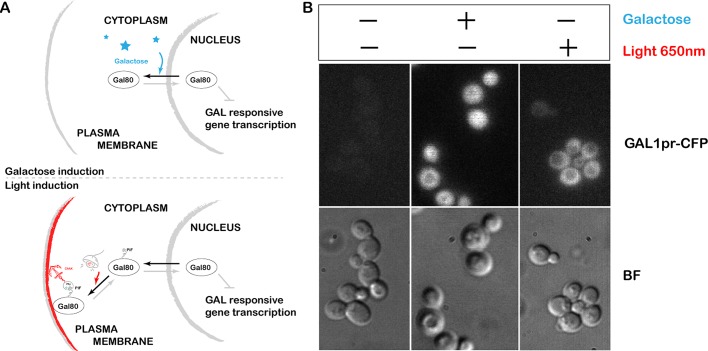
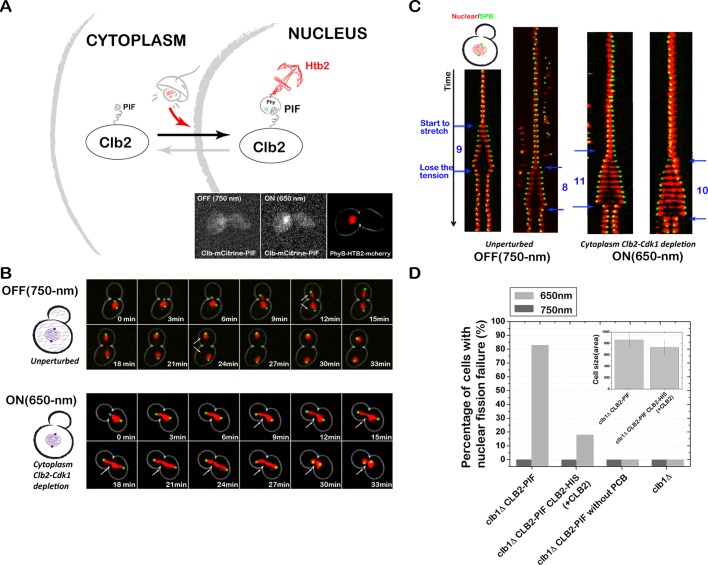
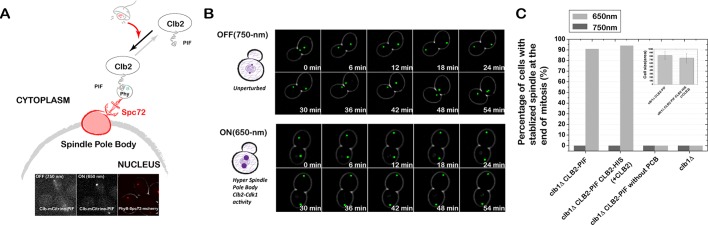
Protein localization plays a central role in cell biology. Although powerful tools exist to assay the spatial and temporal dynamics of proteins in living cells, our ability to control these dynamics has been much more limited. We previously used the phytochrome B- phytochrome-interacting factor light-gated dimerization system to recruit proteins to the plasma membrane, enabling us to control the activation of intracellular signals in mammalian cells. Here we extend this approach to achieve rapid, reversible, and titratable control of protein localization for eight different organelles/positions in budding yeast. By tagging genes at the endogenous locus, we can recruit proteins to or away from their normal sites of action. This system provides a general strategy for dynamically activating or inactivating proteins of interest by controlling their localization and therefore their availability to binding partners and substrates, as we demonstrate for galactose signaling. More importantly, the temporal and spatial precision of the system make it possible to identify when and where a given protein's activity is necessary for function, as we demonstrate for the mitotic cyclin Clb2 in nuclear fission and spindle stabilization. Our light-inducible organelle-targeting system represents a powerful approach for achieving a better understanding of complex biological systems.


Figures

FIGURE 1:
FIGURE 1:
PhyB anchor library construction. (A) Schematic of the PhyB-PIF interaction. (B) Schematic of PhyB anchor library construction. (C) Fluorescence images of our library of PhyB anchor strains, with dashed lines representing cell boundaries. CAAX, plasma membrane targeting sequence; NLS, nuclear localization signal; NES, nuclear export signal. For each strain, example images from all three cell cycle phases are shown. We show an extra image for cell cycle phases when there was particular interest in the dynamics. Stacks of nine images were acquired every 3 min at 30°C, and the maximum-intensity projection of the image stack is shown. (D) List of anchor proteins for which the PhyB fusions were not successful.
FIGURE 2:
FIGURE 2:
PhyB anchors recruit PIF-mCitrine. (A) Schematic of light-gated interaction of PIF-tagged protein with PhyB-tagged anchor. For fluorescence-based visualization, PhyB anchors were tagged with mCherry (red) and PIF was tagged with mCitrine (yellow). (B) Fluorescence images of light-based PIF-Citrine recruitment to PhyB anchor strains. Fluorescence images are the PIF-mCitrine channel.
FIGURE 3:
FIGURE 3:
PIF-Citrine recruitment to PhyB is fast and reversible. (A) Recruitment of PIF-tagged protein (channel, PIF-mCitrine) to multiple PhyB anchors goes to completion in seconds. Top, PIF recruitment to PhyB-CAAX (plasma membrane); bottom, PIF recruitment to PhyB-HTB2 (nucleus). Cells were exposed to 750-nm light for 3 min before switching to 650-nm light. (B) Dissociation of PIF-mCitrine from PhyB anchors also goes to completion in seconds (channel, PIF-mCitrine). Top, PIF release from PhyB-CAAX (plasma membrane); bottom, PIF release from PhyB-HTB2 (nucleus). Cells were exposed to 650-nm light for 3 min before switching to 750-nm light. (C) Representative recruitment profile of PIF to the PhyB-HTB2 anchor. (D) Fluorescence images of PIF recruitment to PhyB-CAAX with the 30-s time interval (channel, PIF-mCitrine). (E, F) Single-cell recruitment (top) and dissociation (bottom) profiles of PIF to/from the PhyB-CAAX anchor. Shown are the fluorescence intensity on plasma membrane (E) and the ratio between the fluorescence intensity on plasma membrane and in cytosol (F) during PIF association to and dissociation from the PhyB-CAAX anchor, respectively.
FIGURE 4:
FIGURE 4:
Repeated recruitment and release of PIF-tagged protein from PhyB anchors. (A) Reversibility of different anchor interactions was tested by rapid alternation between the 650- and 750-nm lights. Typically 20 cycles were tested. PIF-mCitrine images are shown. Example shown here is with a nuclear anchor (PhyB-HTB2). (B) The summary of PIF recruitment dynamics in all anchor strains (Supplemental Movie S1).
FIGURE 5:
FIGURE 5:
The degree of PIF recruitment is titratable and varies among PhyB anchors. (A, B) The degree of PIF protein recruitment to the anchor can be titrated by changing the ratio of 650:750-nm light intensity. The 750-nm light intensity was kept constant, and the 650-nm light intensity was increased step by step. For each step, cells were exposed to 650:750-nm light for 2 min to reach steady state before the measurement. Typical single-cell titration profiles (A) and the average over the population (B) are shown. The straight (red) line shows the linear range of the PIF recruitment in response to red light. (C) Fold increase of PIF protein recruitment to PhyB anchors for 650- vs. 750-nm light. (D) The portion of PIF protein depleted from other positions upon exposure to 650-nm light (1.0 = 100% depletion). For C and D, unlabeled wild-type cells were used to subtract cell autofluorescence, and the PhyB anchor channel was used to define the desired position. Average fluorescence intensity per pixel was used to calculate the decrease/increase. Typically, 50–100 cells were used for each anchor strain. Data were normalized by the single-cell total fluorescence intensity under 750-nm light.
FIGURE 6:
FIGURE 6:
Optogenetic activation of yeast galactose signaling. (A) Schematic of the galactose signaling system. Galactose-based activation of the system: presence of galactose removes the repressor Gal80 from the nucleus, allowing transcription (top). Light-based activation of the system: we used the CAAX (plasma membrane)–anchored PhyB and Gal80 tagged with PIF at the endogenous locus; 650-nm light causes Gal80-PIF to localize to the plasma membrane, pulling it out of the nucleus (bottom), thereby activating galactose-based transcriptional targets. (B) Galactose signaling system can be turned ON by 650-nm light even in the presence of glucose and the absence of galactose. Fluorescence represents cyan fluorescent protein expressed from the Gal1 promoter.
FIGURE 7:
FIGURE 7:
Tethering Clb2 inside the nucleus results in nuclear fission failure. (A) Schematic of optogenetic nuclear recruitment of Clb2, and Clb2 localization under 750- and 650-nm light (inset). (B) Sequestering Clb2 to nucleus (PhyB-HTB2) results in nuclear fission defect. Combined phase and fluorescence time-course images (3-min interval) when Clb2 is not recruited to the nucleus (750-nm light; top and Supplemental Movie S2) vs. when Clb2 is recruited to the nucleus (with 650-nm light; bottom and Supplemental Movies S3 and S4). Red channel represents the nucleus (PhyB-mCherry-HTB2), and the green channel represents the spindle pole body (Spc42-GFP). (C) Kymograph of spindle pole dynamics when Clb2 is unrecruited (system is OFF, left) vs. when Clb2 is recruited to the nucleus (system is ON, right) with a time interval of 3 min. (D) The nuclear fission failure is rescued by adding an extra untagged copy of CLB2, suggesting that nuclear fission failure is likely due to cytoplasmic Clb2 depletion. The average cell size in different strains is shown as the inset.
FIGURE 8:
FIGURE 8:
Tethering Clb2 to the spindle pole body stabilizes the spindle at the end of mitosis. (A) Schematic of optogenetic spindle pole body recruitment of Clb2, and Clb2 localization under 750- and 650-nm light (inset). (B) Combined phase and fluorescence time-course images (6-min interval) when Clb2 is not recruited to the spindle pole body (750-nm light; top) vs. when Clb2 is recruited to the spindle pole body (650-nm light; bottom). Green channel represents the spindle pole body (Spc42-GFP). (C) Clb2 recruitment to the spindle pole body results in significant spindle stabilization. This phenotype is not rescued by adding an extra untagged copy of Clb2, suggesting that the defect is mainly due to the gain of Clb2–CDK function at the SPB. The average cell size in different strains is shown as the inset.
FIGURE 9:
FIGURE 9:
Use of our optogenetic system to identify when Clb2–Cdk1 activity is necessary for nuclear fission. Nuclear fission failure can be rescued by applying a short far-red pulse at the end of mitosis to transiently release Clb2 from the nucleus. (A) Tethering Clb2 to nucleus (PhyB-mCherry-HTB2) results in nuclear fission failure. Kymograph of the nucleus (red channel) and the SPB (green channel) when Clb2 is sequestered in the nucleus (650-nm light) vs. unsequestered Clb2 (750-nm light). The time interval is 3 min. Kymographs of two cells are shown for each condition. (B) We applied 12-min, 750-nm pulses (purple) at the different stages of the cell cycle (time interval is 3 min) to release Clb2 from the nucleus, with 650-nm light (red, Clb2 sequestered in nucleus) delivered at all other times. Red X's and red arrows indicate failed nuclear fission, and black check marks and black arrows indicate successful nuclear fission. Clb2 function is required at the end of mitosis for nuclear fission. (C) We applied 9-min, 750-nm pulses at the different stages of the cell cycle (time interval is 3 min). Red X's and red arrows indicate failed nuclear fission, and black check marks and black arrows indicate successful nuclear fission. These experiments indicate that cytoplasmic Clb2–Cdk1 activity is required at the end of mitosis for nuclear fission.
FIGURE 10:
FIGURE 10:
Use of our optogenetic system to establish the spatial requirements of Clb2–Cdk1 activity in budding yeast. (A) The system is capable of recruiting PIF-mCitrine to only one spindle pole body by restricting the activating light to the daughter. (B) Whereas illuminating both mother and daughter with 650-nm light stabilizes the spindle at the end of mitosis, restricting Clb2 recruitment to either the mother SPB or daughter SPB is not sufficient to stabilize the spindle. Green channel represents the SPB (Spc42-GFP). To control for day-to-day variations in doubling time due to ambient temperature in the microscope room and timing of movie since yeast dilution, experimental (650-nm illuminated) cells were compared with control cells (no 650-nm illumination) in the same microscope field of view.

References

    1. Babst M, Katzmann DJ, Estepa-Sabal EJ, Meerloo T, Emr SD. Escrt-III: an endosome-associated heterooligomeric protein complex required for mvb sorting. Dev Cell. 2002;3:271–282. - PubMed
    1. Bailly E, Cabantous S, Sondaz D, Bernadac A, Simon M-N. Differential cellular localization among mitotic cyclins from Saccharomyces cerevisiae: a new role for the axial budding protein Bud3 in targeting Clb2 to the mother-bud neck. J Cell Sci. 2003;116:4119–4130. - PubMed
    1. Batchelor E, Loewer A, Lahav G. The ups and downs of p53: understanding protein dynamics in single cells. Nat Rev Cancer. 2009;9:371–377. - PMC - PubMed
    1. Baudin A, Ozier-Kalogeropoulos O, Denouel A, Lacroute F, Cullin C. A simple and efficient method for direct gene deletion in Saccharomyces cerevisiae. Nucleic Acids Res. 1993;21:3329–3330. - PMC - PubMed
    1. Bishop, et al. A chemical switch for inhibitor-sensitive alleles of any protein kinase. Nature. 2000;407:395–401. - PubMed

Publication types

MeSH terms