

SigniSite: Identification of residue-level genotype-phenotype correlations in protein multiple sequence alignments
- PMID: 23761454
- PMCID: PMC3692133
- DOI: 10.1093/nar/gkt497
SigniSite: Identification of residue-level genotype-phenotype correlations in protein multiple sequence alignments
Abstract
Identifying which mutation(s) within a given genotype is responsible for an observable phenotype is important in many aspects of molecular biology. Here, we present SigniSite, an online application for subgroup-free residue-level genotype-phenotype correlation. In contrast to similar methods, SigniSite does not require any pre-definition of subgroups or binary classification. Input is a set of protein sequences where each sequence has an associated real number, quantifying a given phenotype. SigniSite will then identify which amino acid residues are significantly associated with the data set phenotype. As output, SigniSite displays a sequence logo, depicting the strength of the phenotype association of each residue and a heat-map identifying 'hot' or 'cold' regions. SigniSite was benchmarked against SPEER, a state-of-the-art method for the prediction of specificity determining positions (SDP) using a set of human immunodeficiency virus protease-inhibitor genotype-phenotype data and corresponding resistance mutation scores from the Stanford University HIV Drug Resistance Database, and a data set of protein families with experimentally annotated SDPs. For both data sets, SigniSite was found to outperform SPEER. SigniSite is available at: http://www.cbs.dtu.dk/services/SigniSite/.
Figures
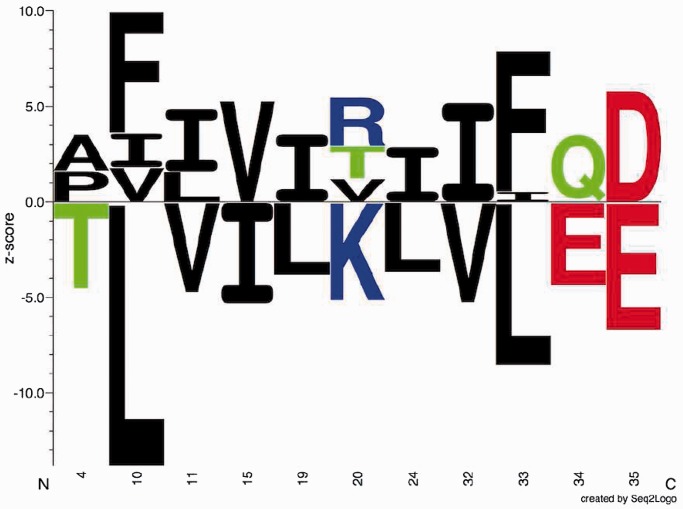
 ). The height of each letter representing the residues is proportional to
  , i.e. the strength of the statistical association between the residue and the data set-phenotype. Residues above the Z = 0 line have a
  , i.e. enhances the phenotype, whereas residues below the Z = 0 line have a
  , i.e. inhibits the phenotype, e.g. the presence of a certain residue with favourable chemical properties may enhance binding (
 ), whereas a residue with unfavourable properties may inhibit binding (
 ). Colour-coding: acidic [DE]: red, basic [HKR]: blue, hydrophobic [ACFILMPVW]: black and neutral [GNQSTY]: green (14).
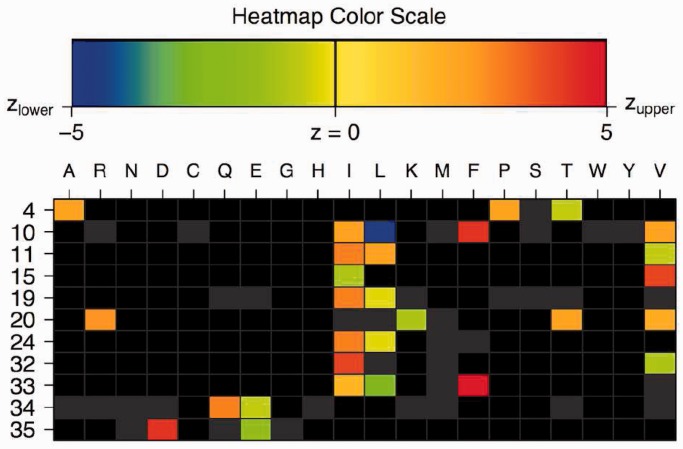
 are blue, whereas
  results in a red field. For
  , nuances in between are used. If a residue has a
  of 0, the cell is coloured grey. Absent residues are coloured black. If only one grey cell is present at a given position, this implies that the position is fully conserved, harbouring only this residue. If more grey cells are present, their associated P-values have become
  after correction for multiple testing.
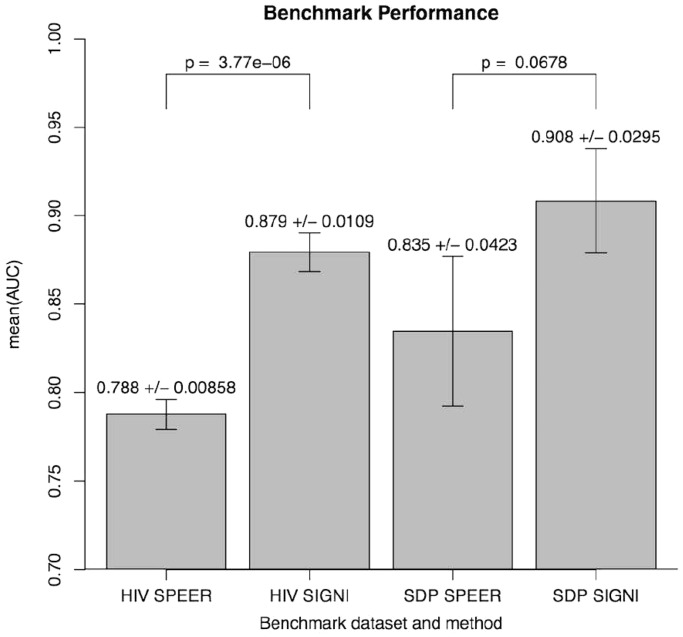
Similar articles
-
Human immunodeficiency virus reverse transcriptase and protease sequence database.Nucleic Acids Res. 2003 Jan 1;31(1):298-303. doi: 10.1093/nar/gkg100. Nucleic Acids Res. 2003. PMID: 12520007 Free PMC article.
-
Enhanced prediction of lopinavir resistance from genotype by use of artificial neural networks.J Infect Dis. 2003 Sep 1;188(5):653-60. doi: 10.1086/377453. Epub 2003 Aug 14. J Infect Dis. 2003. PMID: 12934180
-
Selection of resistance in protease inhibitor-experienced, human immunodeficiency virus type 1-infected subjects failing lopinavir- and ritonavir-based therapy: mutation patterns and baseline correlates.J Virol. 2005 Mar;79(6):3329-38. doi: 10.1128/JVI.79.6.3329-3338.2005. J Virol. 2005. PMID: 15731227 Free PMC article. Clinical Trial.
-
Genotypic analysis methods for detection of drug resistance mutations in the HIV-1 proteinase and reverse transcriptase genes.Antivir Ther. 1999;4(3):135-42. Antivir Ther. 1999. PMID: 12731752 Review.
-
[Basic approaches to anti-HIV resistance].Nihon Rinsho. 2002 Apr;60(4):763-8. Nihon Rinsho. 2002. PMID: 11968785 Review. Japanese.
Cited by
-
Cross-recognition of a pit viper (Crotalinae) polyspecific antivenom explored through high-density peptide microarray epitope mapping.PLoS Negl Trop Dis. 2017 Jul 14;11(7):e0005768. doi: 10.1371/journal.pntd.0005768. eCollection 2017 Jul. PLoS Negl Trop Dis. 2017. PMID: 28708892 Free PMC article.
-
Insights from 20 years of bacterial genome sequencing.Funct Integr Genomics. 2015 Mar;15(2):141-61. doi: 10.1007/s10142-015-0433-4. Epub 2015 Feb 27. Funct Integr Genomics. 2015. PMID: 25722247 Free PMC article. Review.
-
LEON-BIS: multiple alignment evaluation of sequence neighbours using a Bayesian inference system.BMC Bioinformatics. 2016 Jul 7;17(1):271. doi: 10.1186/s12859-016-1146-y. BMC Bioinformatics. 2016. PMID: 27387560 Free PMC article.
-
Identification of a Major Dimorphic Region in the Functionally Critical N-Terminal ID1 Domain of VAR2CSA.PLoS One. 2015 Sep 22;10(9):e0137695. doi: 10.1371/journal.pone.0137695. eCollection 2015. PLoS One. 2015. PMID: 26393516 Free PMC article.
-
NEP: web server for epitope prediction based on antibody neutralization of viral strains with diverse sequences.Nucleic Acids Res. 2014 Jul;42(Web Server issue):W64-71. doi: 10.1093/nar/gku318. Epub 2014 Apr 29. Nucleic Acids Res. 2014. PMID: 24782517 Free PMC article.
References
Publication types
MeSH terms
Substances
Grants and funding
LinkOut - more resources
Full Text Sources
Other Literature Sources
Molecular Biology Databases
Research Materials
