. 2013 Aug 15;305(4):C447-56.
doi: 10.1152/ajpcell.00416.2012. Epub 2013 Jun 12.

Chenodeoxycholic acid stimulates Cl(-) secretion via cAMP signaling and increases cystic fibrosis transmembrane conductance regulator phosphorylation in T84 cells

Affiliations

Chenodeoxycholic acid stimulates Cl(-) secretion via cAMP signaling and increases cystic fibrosis transmembrane conductance regulator phosphorylation in T84 cells

Mei Ao et al. Am J Physiol Cell Physiol. .

Abstract

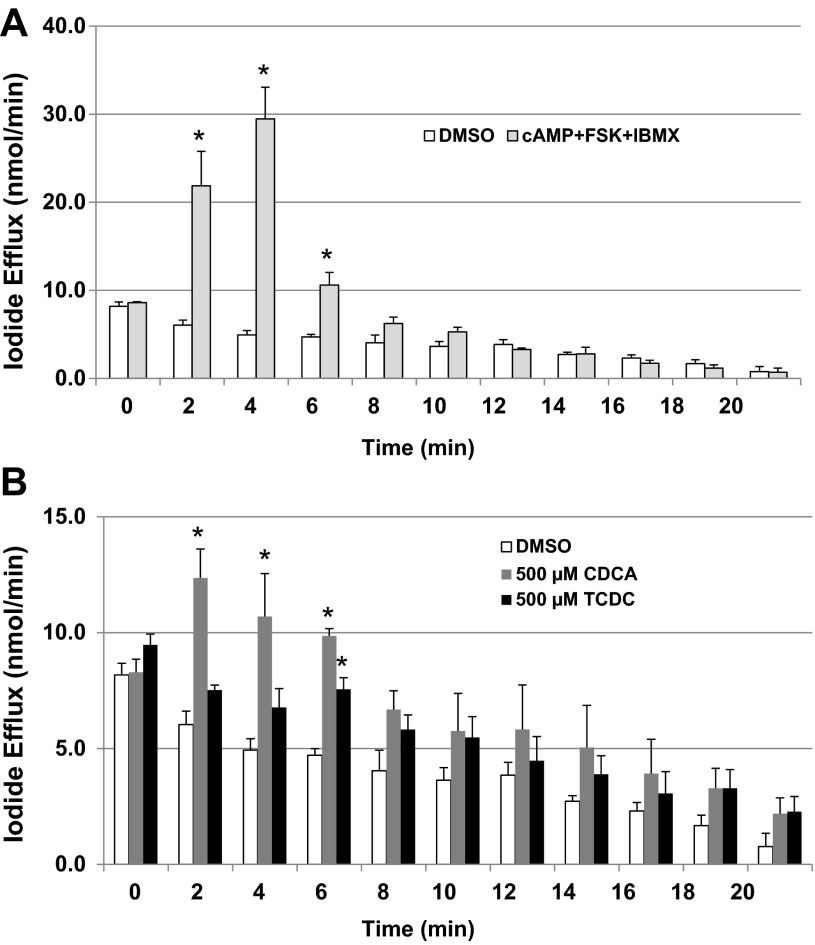
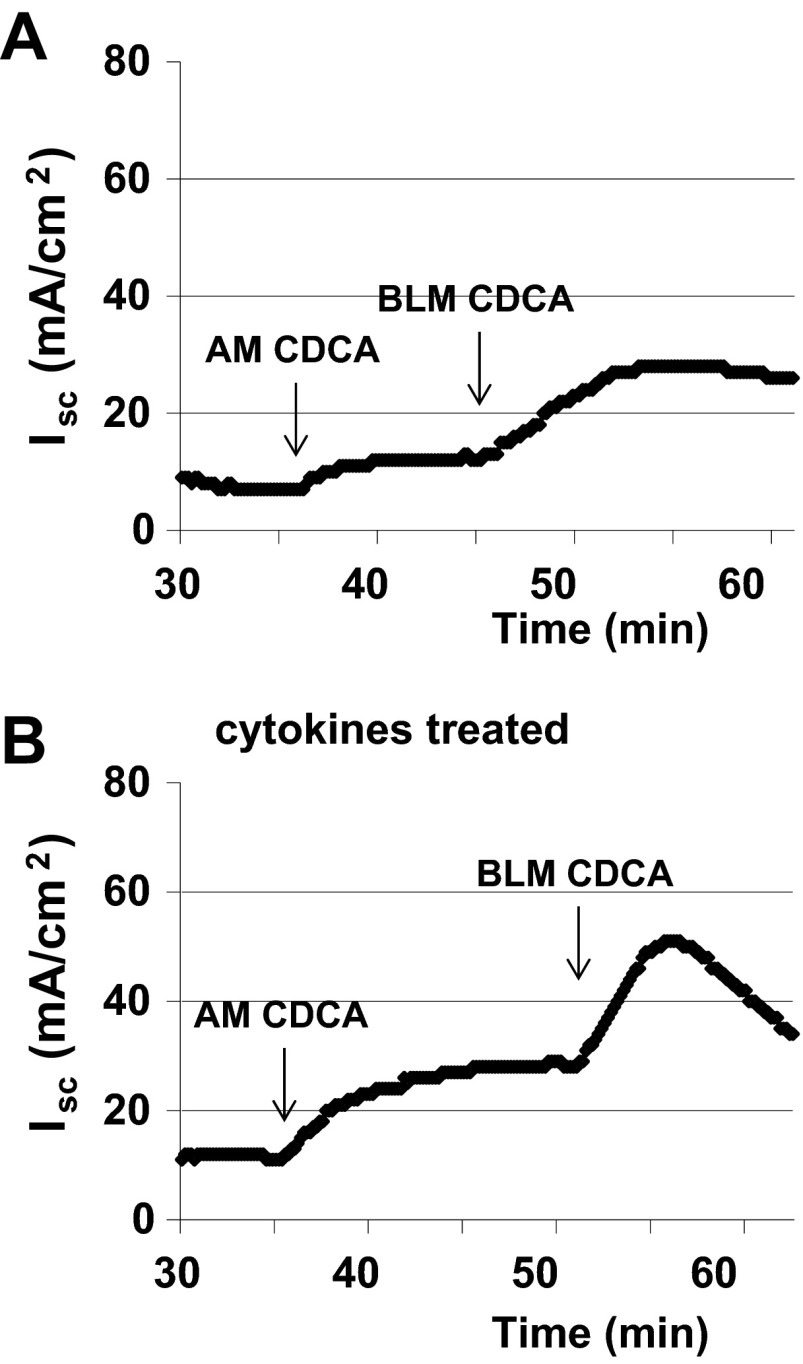
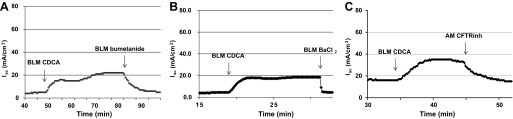
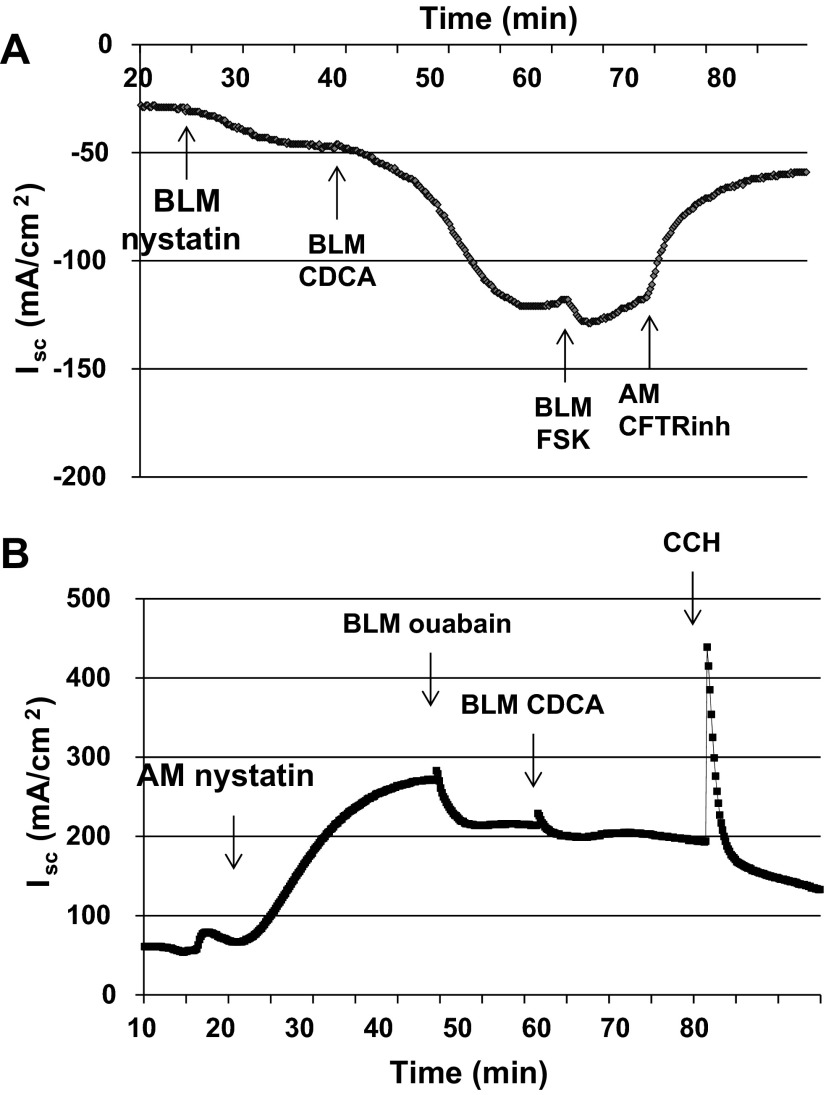
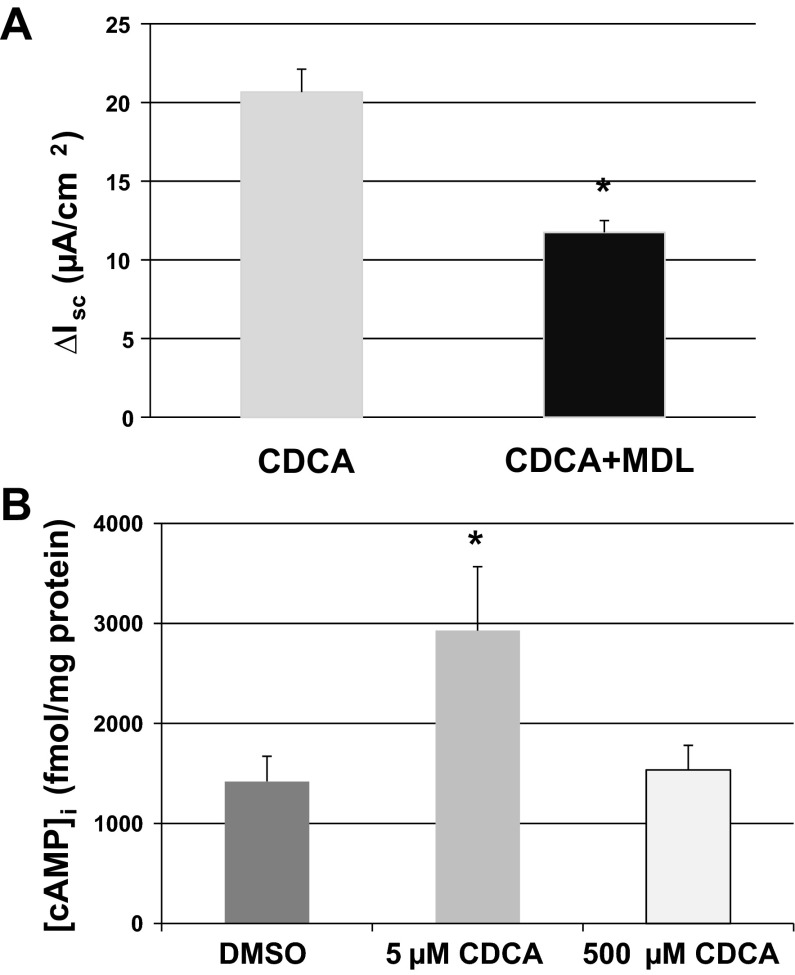
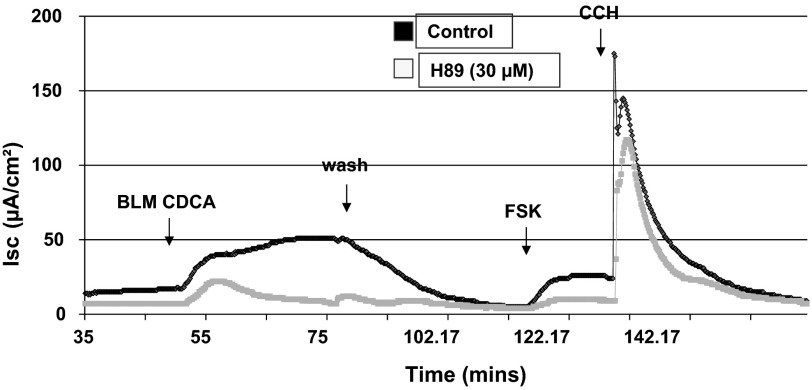
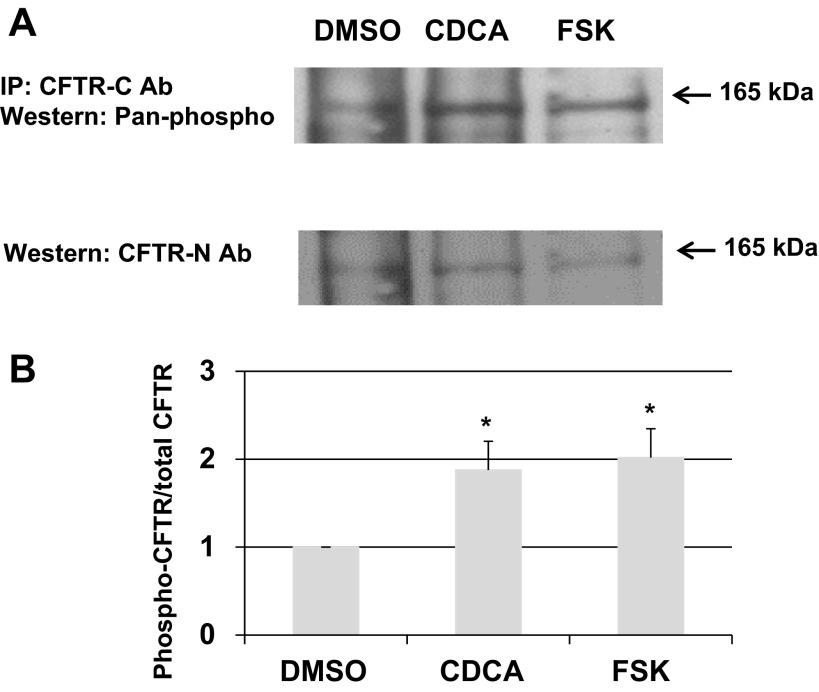
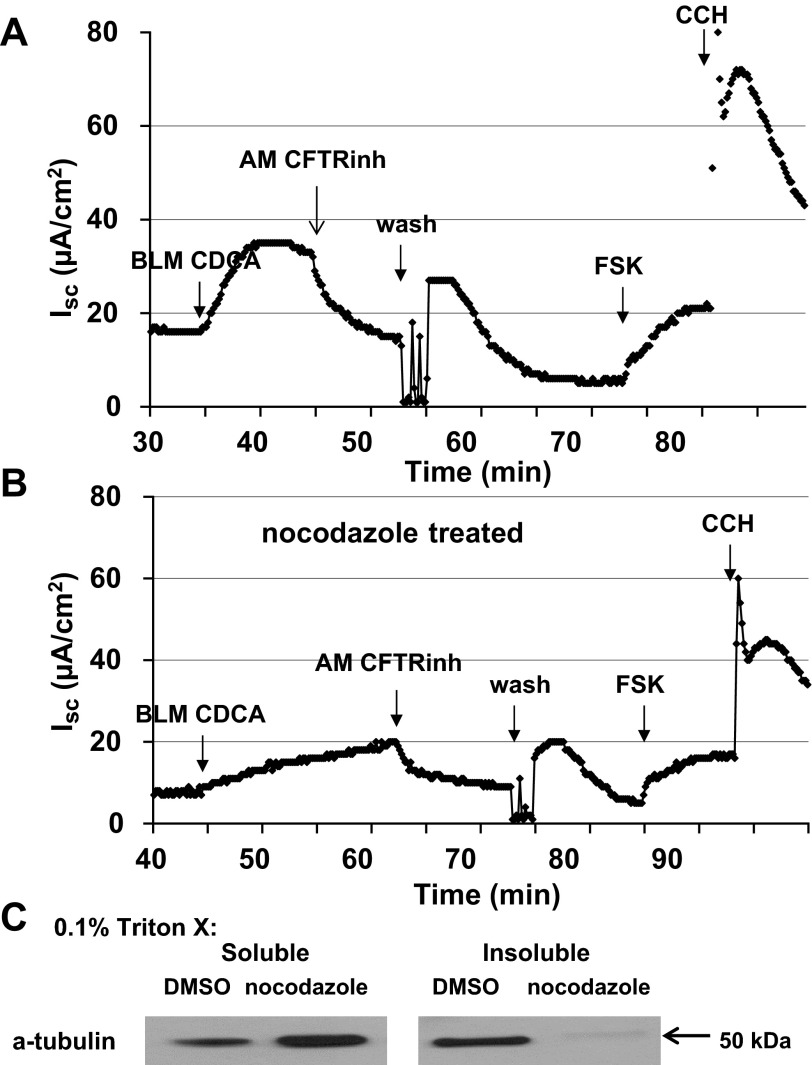
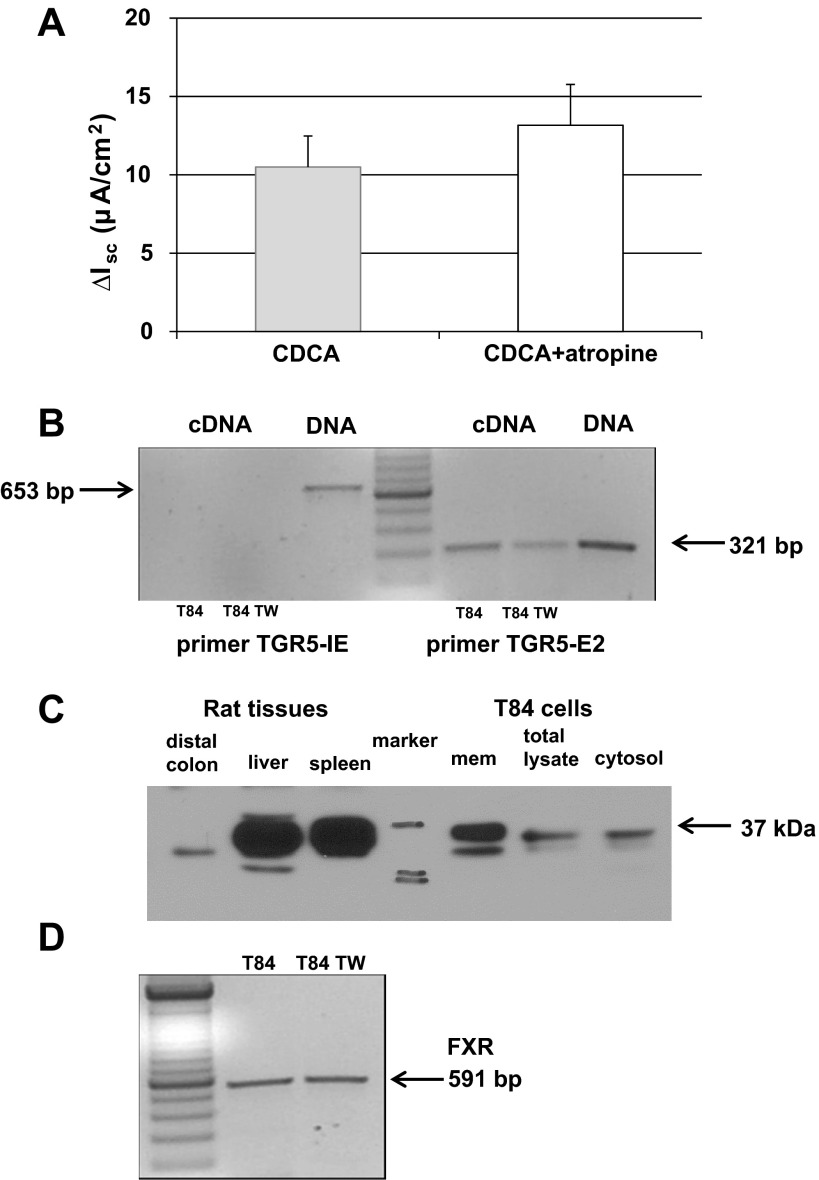
High levels of chenodeoxycholic acid (CDCA) and deoxycholic acid stimulate Cl(-) secretion in mammalian colonic epithelia. While different second messengers have been implicated in this action, the specific signaling pathway has not been fully delineated. Using human colon carcinoma T84 cells, we elucidated this cascade assessing Cl(-) transport by measuring I(-) efflux and short-circuit current (Isc). CDCA (500 μM) rapidly increases I(-) efflux, and we confirmed by Isc that it elicits a larger response when added to the basolateral vs. apical surface. However, preincubation with cytokines increases the monolayer responsiveness to apical addition by 55%. Nystatin permeabilization studies demonstrate that CDCA stimulates an eletrogenic apical Cl(-) but not a basolateral K(+) current. Furthermore, CDCA-induced Isc was inhibited (≥67%) by bumetanide, BaCl2, and the cystic fibrosis transmembrane conductance regulator (CFTR) inhibitor CFTRinh-172. CDCA-stimulated Isc was decreased 43% by the adenylate cyclase inhibitor MDL12330A and CDCA increases intracellular cAMP concentration. The protein kinase A inhibitor H89 and the microtubule disrupting agent nocodazole, respectively, cause 94 and 47% reductions in CDCA-stimulated Isc. Immunoprecipitation with CFTR antibodies, followed by sequential immunoblotting with Pan-phospho and CFTR antibodies, shows that CDCA increases CFTR phosphorylation by approximately twofold. The rapidity and side specificity of the response to CDCA imply a membrane-mediated process. While CDCA effects are not blocked by the muscarinic receptor antagonist atropine, T84 cells possess transcript and protein for the bile acid G protein-coupled receptor TGR5. These results demonstrate for the first time that CDCA activates CFTR via a cAMP-PKA pathway involving microtubules and imply that this occurs via a basolateral membrane receptor.

Keywords: CDCA; CFTR; T84 cells; cAMP signaling.


Figures

Fig. 1.
Fig. 1.
Effect of chenodeoxycholic acid (CDCA) on iodide efflux in T84 cells. T84 cells grown in 6-well plates were treated with 0.2% DMSO, cAMP cocktail [100 μM 8-bromo (Br)-cAMP + 10 μM forskolin + 100 μM IBMX; A], CDCA (500 μM), or taurine conjugate TCDC (500 μM; B). Iodide efflux assay was performed as described in materials and methods. Bar graphs show iodide efflux rate (nmol/min), which was calculated over a 2-min interval. Data are expressed as the means ± SE of 3 independent experiments. *P < 0.05, compared with 0.2% DMSO.
Fig. 2.
Fig. 2.
Effect of CDCA on short-circuit current (Isc) in T84 monolayers in the absence and presence of cytokines. T84 cell monolayers were incubated with a cytokine cocktail containing TNFα (10 ng/ml), interferon-γ (30 ng/ml), and IL-1β (10 ng/ml) for 24 h before being mounted in Ussing chambers. CDCA (500 μM) was first added to the apical chamber and then added to the basolateral chamber. Representative tracing of Isc shows the effect of CDCA in the control (A; n = 3) and cytokines-treated (B; n = 4) T84 monolayers. AM, exposure of apical membrane to CDCA; BLM, exposure of basolateral membrane to CDCA.
Fig. 3.
Fig. 3.
Effect of inhibitors of transepithelial Cl secretion on CDCA-induced changes in Isc. T84 cells grown in Transwells were mounted in Ussing chambers. CDCA (500 μM) was added to the basolateral solution. Bumetanide (100 μM BLM; A), BaCl2 (5 mM BLM; B), or CFTRinh-172 (10 μM AM; C) was added after Isc reached plateau and stayed steady for ∼10 min. Data depicted are representative tracings of n ≥ 3 experiments.
Fig. 4.
Fig. 4.
Effect of CDCA on Isc in nystatin-permeablized T84 cells. T84 cells grown in Transwells were mounted in Ussing chambers. Representative tracings of Isc show CDCA the effect of CDCA on basolaterally (A; n = 4) or apically (B; n = 5) permeablized T84 cells. A: basolateral membranes of T84 cells were permeabilized with nystatin (200 μg/ml) in the presence of an apical to basolateral Cl gradient. CDCA (500 μM) was added to the basolateral solution, and after the Isc had stabilized, forskolin (10 μM) was added to the basolateral solution followed by CFTRinh-172 (10 μM) to the apical solution. B: apical membranes of T84 cells were permeabilized with nystatin in the presence of an apical to basolateral K+ gradient. Sequentially ouabain (100 μM), CDCA (500 μM), and carbachol (CCH; 100 μM) were added to the basolateral solution.
Fig. 5.
Fig. 5.
The role of the cAMP-dependent pathway in the actions of CDCA. A: T84 cells mounted in Ussing chambers were incubated with 50 μM adenylate cyclase inhibitor MDL12330A for 25 min before the basolateral addition of CDCA (500 μM). Bar graph shows the Isc change elicited by CDCA ± MDL12330A. *Statistically significant difference in ΔIsc (P < 0.05) compared with CDCA alone; n = 4. B: T84 cells grown in 96 well-plates were incubated with 0.1% DMSO or 5 μM CDCA or 500 μM CDCA for 20 min, and [cAMP]i was measured using enzyme immunoassay. Bar graph shows the intracellular cAMP concentration ([cAMP]i), expressed in fmole/mg protein. *Statistically significant difference in [cAMP]i (P < 0.05) compared with 0.1% DMSO; n ≥ 4.
Fig. 6.
Fig. 6.
Effect of PKA inhibition on CDCA-stimulated Isc in T84 cells. T84 cells mounted in the Ussing chamber were incubated with either 0.1% DMSO or 30 μM H89 for 30 min before the basolateral addition of CDCA (500 μM). Representative tracings of Isc show the effect of CDCA in control (black line) and H89 (gray line)-treated T84 cells; n = 3. Forskolin (FSK; 10 μM) and carbachol (100 μM) were added at the end to test the viability of the cells.
Fig. 7.
Fig. 7.
Effect of CDCA on CFTR phosphorylation in T84 cells. T84 cells grown in 6-well Transwells were treated with 0.1% DMSO, 500 μM CDCA, or 10 μM forskolin basolaterally for 20 min. Immunoprecipitation (IP) and immunoblot were performed as described in materials and methods. A: representative blot shows 1 of 4 experiments. B: Quantification of phosphorylation as shown in A. The CFTR phosphorylation ratio (phospho-CFTR density/total CFTR density) in the DMSO control was set at “1” for all 4 experiments, and used to normalize the data. *Statistically significant difference in phosphorylation (n = 4; P < 0.05) compared with 0.1% DMSO.
Fig. 8.
Fig. 8.
Role of microtubules in the effect of CDCA on Isc in T84 cells. T84 cells grown in Transwells were pretreated with DMSO (0.1%) or nocodazole (33 μM, bilateral) first on ice for 30 min, and then were mounted in Ussing chambers where they were treated for an additional 30 min at 37°C. CDCA (500 μM) was added to the basolateral solution. Representative tracings of Isc show the effects of CDCA in control (A) and nocodazole (B)-treated T84 cells; n = 3. C: representative blot shows the 0.1% Triton X-100 soluble and insoluble α-tubulin in T84 cells treated with DMSO or nocodazole. Estimated size of the α-tubulin protein is 50 kDa; n = 3.
Fig. 9.
Fig. 9.
Function and expression of known bile acid receptors. A: T84 cells mounted in the Ussing chamber were incubated with either 0.1% DMSO or 10 μM atropine for 30 min before the basolateral addition of CDCA (500 μM). Bar graph shows the Isc change elicited by CDCA ± atropine; n = 6. B: representative RT-PCR result shows the presence of TGR5 mRNA in T84 cells. As described in materials and methods and results, 2 different primers were used; TGR5-IE which spans part of the intron between exon 1 and 2 and part of exon 2 and TGR5-E2 which spans only exon 2. TW, Transwell. C: representative blot shows the presence of TGR5 protein in T84 cells. Rat liver, spleen, and distal colon tissues were used as positive controls. Data shown in B and C are representative of three separate experiments. Estimated size of the TGR5 protein is 37 kDa. D: representative RT-PCR result shows the presence of FXR mRNA in T84 cells grown on cell culture dishes or Transwells (n = 3).

References

    1. Alrefai WA, Gill RK. Bile acid transporters: structure, function, regulation and pathophysiological implications. Pharm Res 24: 1803– 1823, 2007 - PubMed
    1. Ao M, Venkatasubramanian J, Boonkaewwan C, Ganesan N, Syed A, Benya RV, Rao MC. Lubiprostone activates Cl- secretion via cAMP signaling and increases membrane CFTR in the human colon carcinoma cell line, T84. Dig Dis Sci 56: 339– 351, 2011 - PubMed
    1. Barrett KE. Positive and negative regulation of chloride secretion in T84 cells. Am J Physiol Cell Physiol 265: C859– C868, 1993 - PubMed
    1. Bijvelds MJ, Jorna H, Verkade HJ, Bot AG, Hofmann F, Agellon LB, Sinaasappel M, de Jonge HR. Activation of CFTR by ASBT-mediated bile salt absorption. Am J Physiol Gastrointest Liver Physiol 289: G870– G879, 2005 - PubMed
    1. Boonkaewwan C, Ao M, Toskulkao C, Rao MC. Specific immunomodulatory and secretory activities of stevioside and steviol in intestinal cells. J Agric Food Chem 56: 3777– 3784, 2008 - PubMed

Publication types

MeSH terms