. 2013 Jun 6:7:104.
doi: 10.3389/fncir.2013.00104. eCollection 2013.

Two-photon calcium imaging during fictive navigation in virtual environments

Affiliations

Two-photon calcium imaging during fictive navigation in virtual environments

Misha B Ahrens et al. Front Neural Circuits. .

Abstract

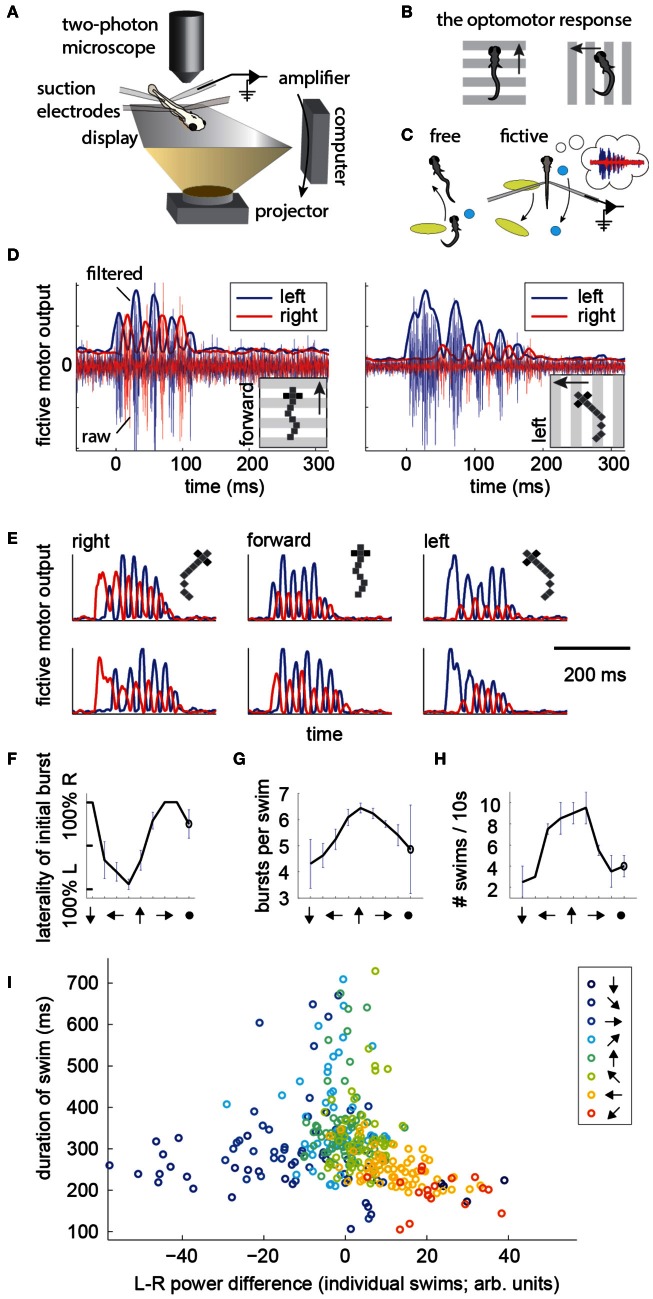
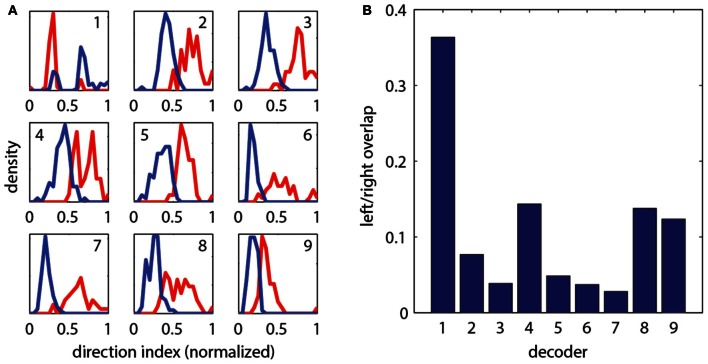
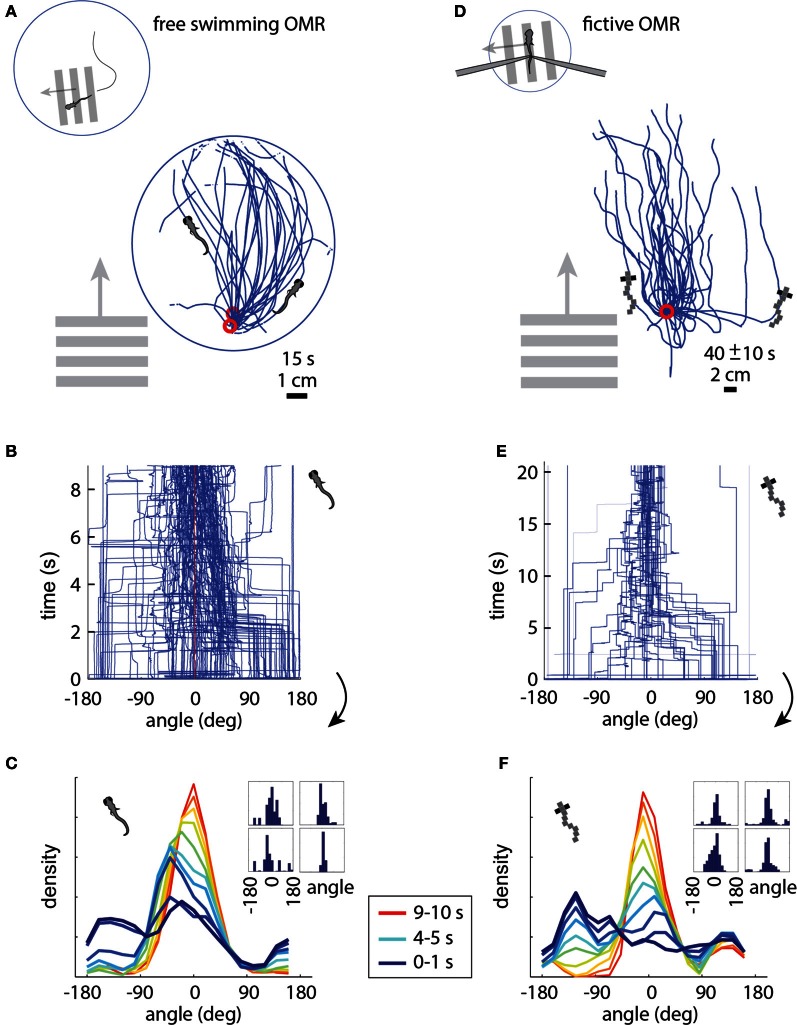
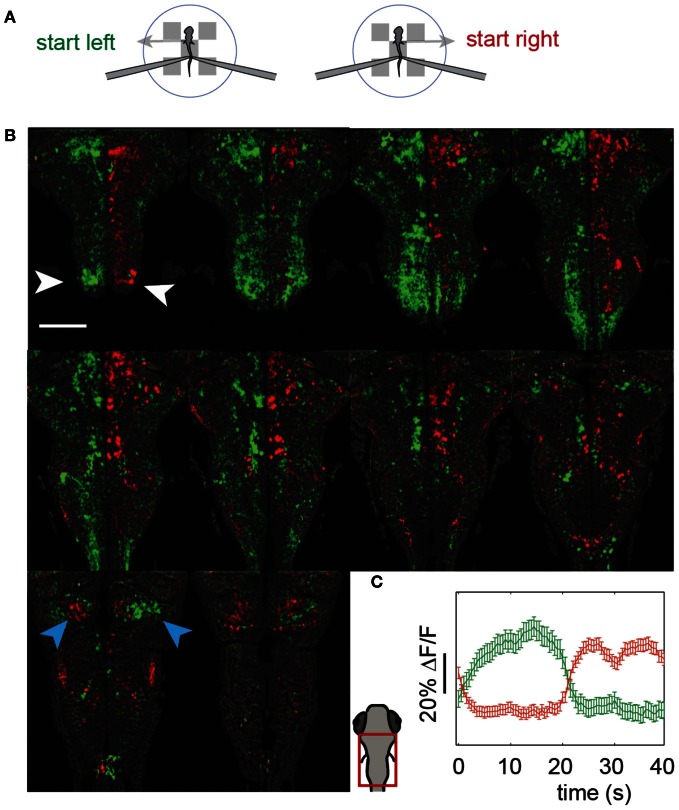
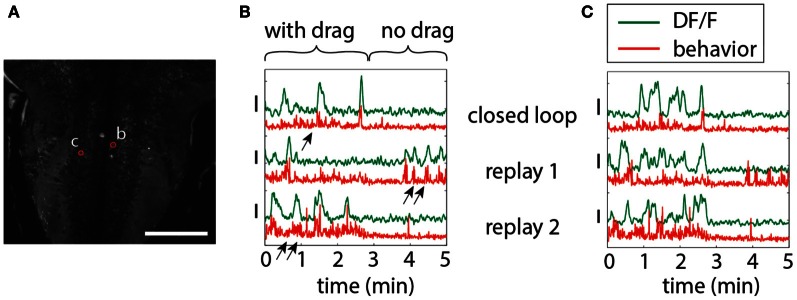
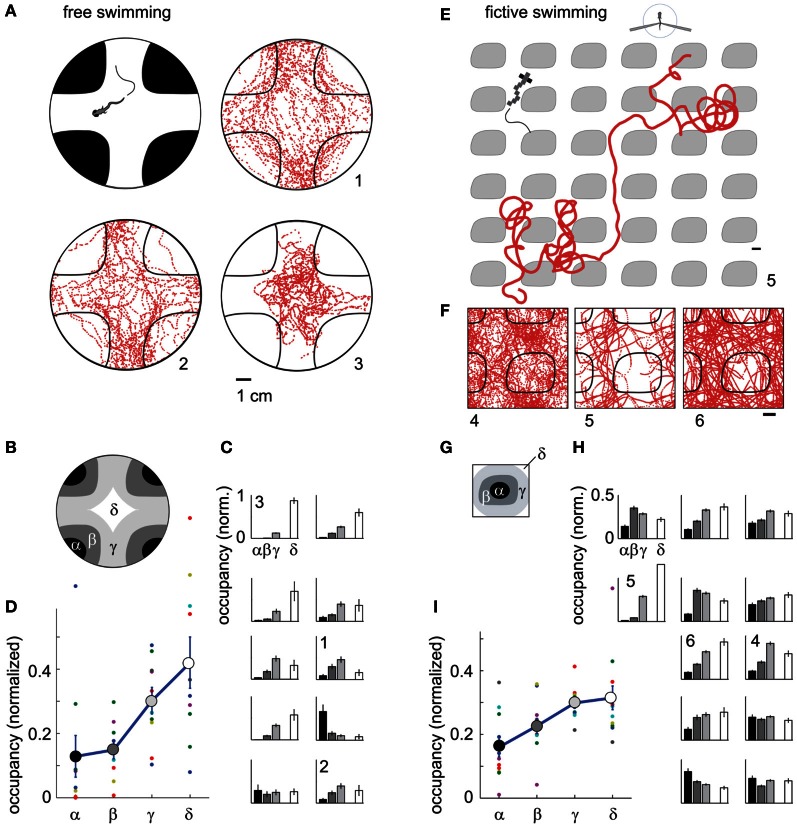
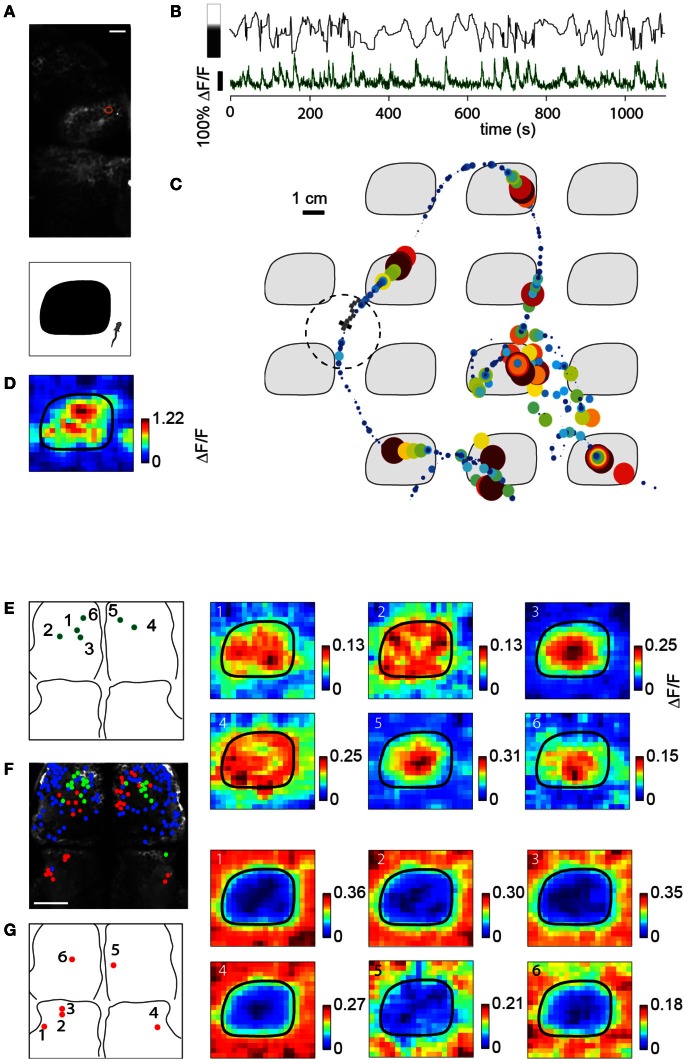
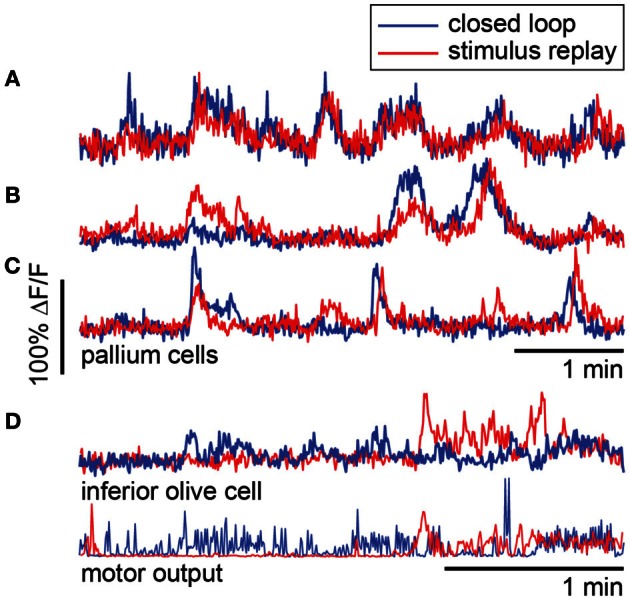
A full understanding of nervous system function requires recording from large populations of neurons during naturalistic behaviors. Here we enable paralyzed larval zebrafish to fictively navigate two-dimensional virtual environments while we record optically from many neurons with two-photon imaging. Electrical recordings from motor nerves in the tail are decoded into intended forward swims and turns, which are used to update a virtual environment displayed underneath the fish. Several behavioral features-such as turning responses to whole-field motion and dark avoidance-are well-replicated in this virtual setting. We readily observed neuronal populations in the hindbrain with laterally selective responses that correlated with right or left optomotor behavior. We also observed neurons in the habenula, pallium, and midbrain with response properties specific to environmental features. Beyond single-cell correlations, the classification of network activity in such virtual settings promises to reveal principles of brainwide neural dynamics during behavior.

Keywords: behavior; motor control; sensorimotor transformations; two-photon calcium imaging; virtual reality; zebrafish.


Figures

Figure 1
Figure 1
Electrical signatures of fictive forward swims and turns in paralyzed fish. (A) Fictive virtual-reality setup. A larval zebrafish is paralyzed, head-embedded in agar or suspended from pipettes, and suction electrodes record activity from motor neuron axons. Motor neuron activity is used to simulate movement through a virtual environment which is projected on a display underneath the fish. A two-photon microscope records neuronal activity as reported by a genetically-encoded calcium indicator. Right: schematic of the correspondence between free swimming behavior and fictive behavior. In each case, the movement of the world, as seen from the fish's point of view, is the same. (B) Schematic of the optomotor response (OMR) in a freely swimming fish (top view). Fish turn and swim along with the direction of whole-field motion. (C) Schematic of the goal of the current work. Left: a freely swimming fish makes a left turn (top view). Right: a fictively swimming paralyzed fish intends to make a left turn, upon which the virtual environment projected underneath the fish shifts to induce the same optical translation as observed by the freely swimming fish. (D) Left: example of a fictive forward swim. This was elicited by forward, tail-to-head whole-field motion. The pixelized fish indicates that this is fictive behavior. Right: example of a fictive turn to the left, elicited by leftward whole-field motion. Thin lines depict electrical signal, thick lines represent the local standard deviation in a running window of 10 ms. Data in panels (D–H) is from one representative fish. (E) Additional examples of fictive turns and forward swim bouts. (F–H) Statistics of responses to whole-field motion in a typical fish. Each point on the graph represents a different direction of whole-field motion. The last point represents a static scene. (F) Probability of above-threshold activity occurring on the left or the right electrode for a typical fish. This open-loop behavior is similar to “virtual open loop” behavior observed in freely swimming fish (Orger et al., 2000). (G) Number of bursts per swim is largest for forward visual stimulation. (H) Number of swim bouts in a 10 s window increases with larger forward component of visual motion. (I) Difference in power of the left and right channels as a function of the direction of visual stimulation, showing a systematic relationship between these two variables, suggesting that left-right power difference may code for intended turn angle.
Figure 2
Figure 2
Evaluation of different strategies for decoding fictive turn direction. (A) Histograms of normalized direction index of nine different decoders, over 127 total swim bouts (one representative fish). Left and right moving gratings were presented to paralyzed fish while their fictive responses were recorded. Nine different decoders each produced different sets of direction indices (red: responses to right, blue: responses to left). Decoding strategies were (“bumps” refers to the oscillations visible in the fictive swim bouts, as in Figure 1): (1) Ratio of width of first left and right bumps of the processed fictive signal, (2) Ratio of heights of the first bumps, (3) Ratio of the left and right power of the entire swim bout, (4) Ratio of the areas of the first bump of the left and right swim bout, (5) Difference in the widths of the first bumps, (6) Difference in the heights of the first bumps, (7) Difference in left and right power of the entire swim bout, (8) Difference in the areas of the first bumps, (9) Difference in the rise time (time to peak) of the first bumps. It can be seen that each decoder produces segregation between the responses to the left and right moving visual stimuli, but some cause more segregation than others. (B) Quantification of overlap in direction index of the nine decoders (lower value indicates better performance). Decoder (7), the difference in power between the left and right channels over the entire swim bout, performs the best.
Figure 3
Figure 3
The optomotor response in free (A–C) and paralyzed (D–F) fish. (A) Swim trajectories during visual whole-field motion projected at the bottom of a 10 cm petri dish (N = 3 example fish). Grating period was 1 cm, speed 1 cm/s. Data have been rotated so that the starting point is near the bottom of the dish, as seen from above. (B) Heading angle over time for N = 6 freely swimming fish. The time axis is cut off at 9 s, because at that time a number of fish reached the end of the petri dish and the heading angle became ill-defined. (C) Changing heading direction over time; same data as (B). Dark blue: histogram at start of trials (N = 6 fish, 10 trials each). Red: histogram 10 s after trial onset. Each color represents one second of data. Inset: Histograms of heading angle, centered at zero degrees, which is the direction of motion (4 representative fish). (D) Fictive swim trajectories in the virtual reality version of the OMR. Like freely swimming fish, the paralyzed fish turn in the direction of motion and swim along with it (N = 6 fish). (E) Heading direction over time for N = 6 paralyzed fish. Note that the time axis is different from (B) (because distance in the virtual environment was not limited by a petri dish), but the dynamics are similar (see panels C and F). (F) Changing heading direction over time (N = 6 fish; same data as E). Colors as in (C). The time course of heading angle change is similar to the freely swimming case shown in C. Inset: Angle histograms of four representative fish over the entire experiment.
Figure 4
Figure 4
Whole-hindbrain imaging during left/right biased optomotor behavior. (A) Summary of fictive behavioral assay. The assay was identical to the optomotor assay (Figure 3), but the angle was perturbed every 10 s and set to leftward (0 s), leftward (10 s), rightward (20 s), rightward (30 s), repeating. In this way, the fish was biased to turn left during 20 s, and to turn right during 20 s. This sequence was repeated twice, over a period of 80 s, for each imaged plane. (B) Two-photon imaging of most of the hindbrain during the assay. The imaging area is shown in the schematic of the larval head. Planes 5 μm apart were imaged each for 80 s (A). Data are displayed as the average of three consecutive planes (i.e., 15 μm between panels), and represent the difference in average calcium signal over the left (green) and the right (red) periods (i.e., activity during 0–20 and 40–60 s, minus activity during 20–40 and 60–80 s, for each plane); for the ΔF/F scale over time, see (C). An approximate lateral organization of activity during the left and right periods can be seen, including in the inferior olive (white arrows). The polarization is flipped in regions of the cerebellar cortex (blue arrows), consistent with cerebellar anatomy; climbing fibers from the inferior olive cross contralaterally before projecting to the cerebellar cortex. Scale bar, 100 μm. (C) Average activity of the red and green populations over the 40 s of the assay (A). Error bars: standard error across neurons (including neuron-sized areas of neuropil).
Figure 5
Figure 5
Differences in neuronal responses to closed-loop and open-loop visual stimulation. Five minutes of closed-loop virtual behavior was followed by two replay runs, during which the recorded visual stimulus was played back in open-loop. In closed-loop, a period with drag (forward stimulus motion in the absence of swimming, simulating a backward water current) was followed by a period without drag (no stimulus motion in the absence of swimming). (A) Hindbrain anatomy, with neurons b and c marked in red. Scale bar: 100 μm. (B) Motor-related neuronal activity, with increased fluorescence signal during more vigorous swimming. Note that the behavior, as well as the neuronal activity, is different during closed-loop and open-loop replay, underlining the importance of closed-loop virtual behavior above simple open-loop stimulus presentation. Behavior, as also shown before (Ahrens et al., 2012), is qualitatively different in closed- and open-loop, with open-loop behavior often more vigorous (double arrows) than closed-loop behavior (single arrow). (C) Non-motor-related neuron activity that may be visually driven. Patterns of activity during closed- and open-loop are similar, but not identical, and bear no correlation to motor output (e.g., see replay 1). This suggests that this cell is driven by visual input, albeit in a non-trivial way.
Figure 6
Figure 6
Darkness avoidance in free and paralyzed fish. (A) Top view schematic of the arena, consisting of a 10 cm petri dish on top of a visual display. Display color was red to replicate the color used during two-photon imaging. Shown are trajectories of 3 fish over 20 min of experimental time (labeled 1–3). On average, fish spend more time in the bright region. (B) Subdivisions α − δ of the arena used for further analysis of location preference. (C) Time spent in the areas α − δ (N = 10 fish). Eight fish preferentially stay in the bright region; one fish spends more time in the dark region; one fish does not distinguish. Error bars computed from Bernoulli distribution over counts, then normalized to the area of the four regions. (D) Average normalized occupancy of regions α − δ (N = 10 fish) shows a strong and graded bias toward staying in the bright regions. (E) Example trajectory of paralyzed fish through the virtual environment. Scale bar, 1 cm. (F) Complete trajectories of three fish over all tiles of the virtual environment, shown in relation to a single tile and parts of neighboring tiles. (G) Subdivisions of one tile, with α and β the center and boundary of a dark tile, and δ and δ inner and outer areas of the bright space, as in (B). (H) Occupancy over areas α − δ of all tiles in the virtual environment (N = 12 paralyzed fish). Most fish spend less time in the dark. Some also avoid the center of the white areas (δ), such as fish 4. (I) Average normalized occupancy of bright to dark regions α − δ of the virtual environment shows graded preference to bright areas. Differences in occupancy are smaller than in freely swimming fish (D).
Figure 7
Figure 7
Imaging sensory activity during fictive navigation. (A) Top: Two-photon image of right anterior midbrain and forebrain, with neuron displayed in (B–D) circled in red. Scale bar: 20 um. Bottom: schematic of one tile of the virtual environment. (B) Activity of neuron outlined in (A) during fictive navigation of a transgenic elavl3:GCaMP5 fish expressing a genetically-encoded calcium indicator in almost all neurons. Top: Distance from the center of the nearest dark patch, with bar on the left indicating approximate brightness. Bottom: ΔF/F. Peaks in ΔF/F coincide with approaches to the center of a dark patch. (C) Neural activity overlaid on the path through the virtual environment. Activity is represented by size and color, with largest discs corresponding to ΔF/F = 1. Seven minutes of the experiment are shown. (D) Neural activity averaged over the entire trajectory, averaged over one tile. This activity pattern is consistent with a neuron activated by darkness. (E) Left: Locations of six dark-responding neurons in the pallium of a fictively navigating fish with activity patterns shown on the right. Right: Activity of these neurons is similarly modulated as in (D) while this paralyzed fish traverses the light-modulated environment. Details of the activity maps vary; for example, high activity of neurons 5 and 6 is constrained to the center of the black patches, whereas that of neurons 2 and 4 is more broadly distributed within patches. (F) Anatomy of anterior midbrain and pallium of this fish, with neuron positions superimposed. Green: neurons responding to dark areas, red: neurons responding to bright areas, blue: neurons with no significant location-dependent change in activity. (G) Left: Locations of six light-responsive neurons (2,3,5,6) and neuropil regions (1,4), right: response maps of these neurons, showing suppression of activity when the fish is on a dark patch, and excitation when it is on a bright region.
Figure 8
Figure 8
Forebrain activity during closed- and open-loop navigation in a dark-modulated environment is largely stimulus-locked. (A–C) Recordings from pallial neurons during two-dimensional darkness avoidance. For 5 min, fish navigated a virtual environment. Next, the stimulus presented during this period was repeated in open-loop. Neural activity during the first 5 min shown in blue; activity during the five minutes of stimulus replay shown in red. Neurons a–c are in the same fish, over the same period. (A) Activity in this neuron is identical during the closed- and open-loop periods, indicating that this is a visually-driven neuron with activity that is highly predictable from the visual stimulus alone. (B,C) Two neurons that are stimulus-driven, but whose activity is differently modulated during closed-loop and open-loop replay. Differences in activity may represent differences in the state of the brain during closed- and open-loop control. (D) For comparison, a neuron in the inferior olive with activity that is different during closed-loop and open-loop replay. Activity in this neuron correlates with motor output (bottom). Data were obtained using a one-dimensional OMR assay (Ahrens et al., 2012). Swim patterns during closed- and open-loop are qualitatively different, with behavior in closed-loop being more ongoing, and behavior in open-loop characterized by periods of quiescence and periods of vigorous swimming. These patterns are also reflected in the neural activity.

References

    1. Ahrens M. B., Li J. M., Orger M. B., Robson D. N., Schier A. F., Engert F., et al. (2012). Brain-wide neuronal dynamics during motor adaptation in zebrafish. Nature 485, 471–477 10.1038/nature11057 - DOI - PMC - PubMed
    1. Ahrens M. B., Orger M. B., Robson D. N., Li J. M., Keller P. J. (2013). Whole-brain functional imaging at cellular resolution using light-sheet microscopy. Nat. Methods 10, 413–420 10.1038/nmeth.2434 - DOI - PubMed
    1. Aizenberg M., Schuman E. M. (2011). Cerebellar-dependent learning in larval zebrafish. J. Neurosci. 31, 8708–8712 10.1523/JNEUROSCI.6565-10.2011 - DOI - PMC - PubMed
    1. Akerboom J., Chen T. W., Wardill T. J., Tian L., Marvin J. S., Mutlu S., et al. (2012). Optimization of a GCaMP calcium indicator for neural activity imaging. J. Neurosci. 32, 13819–13840 10.1523/JNEUROSCI.2601-12.2012 - DOI - PMC - PubMed
    1. Bianco I. H., Kampff A. R., Engert F. (2011). Prey capture behavior evoked by simple visual stimuli in larval zebrafish. Front. Syst. Neurosci. 5:101 10.3389/fnsys.2011.00101 - DOI - PMC - PubMed

Publication types

LinkOut - more resources