. 2013;11(6):e1001577.
doi: 10.1371/journal.pbio.1001577. Epub 2013 Jun 4.

Myelin membrane assembly is driven by a phase transition of myelin basic proteins into a cohesive protein meshwork

Affiliations

Myelin membrane assembly is driven by a phase transition of myelin basic proteins into a cohesive protein meshwork

Shweta Aggarwal et al. PLoS Biol. 2013.

Abstract

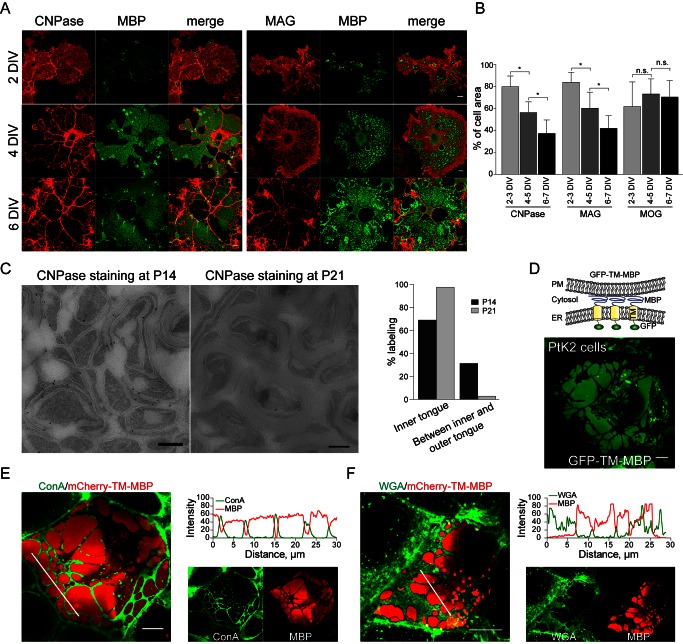
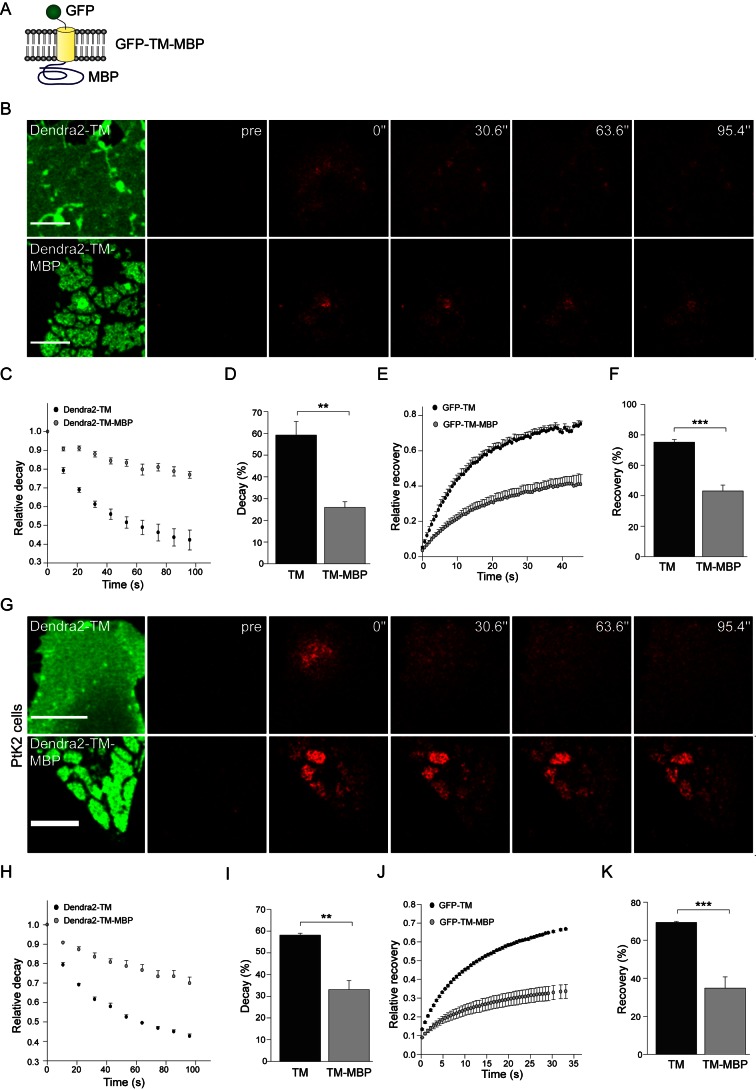
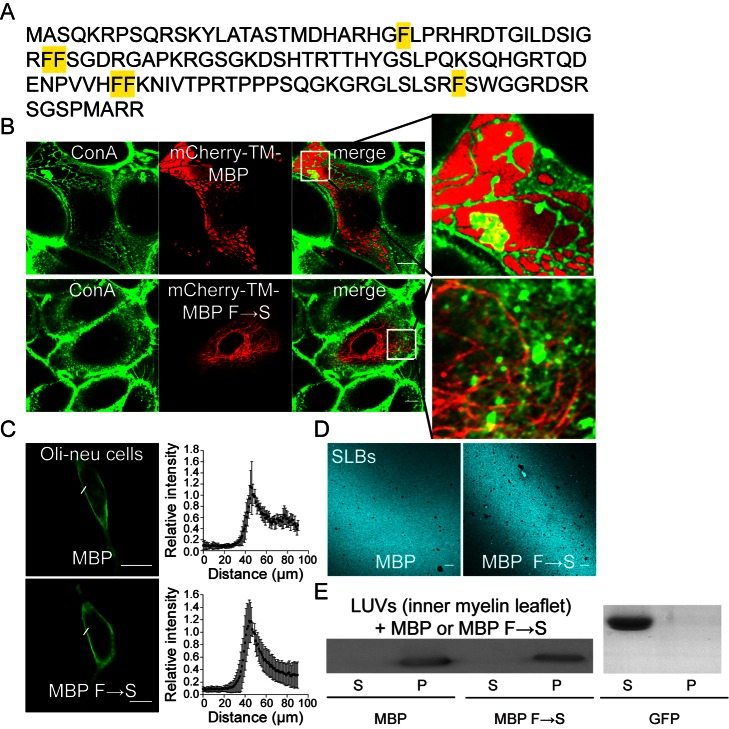
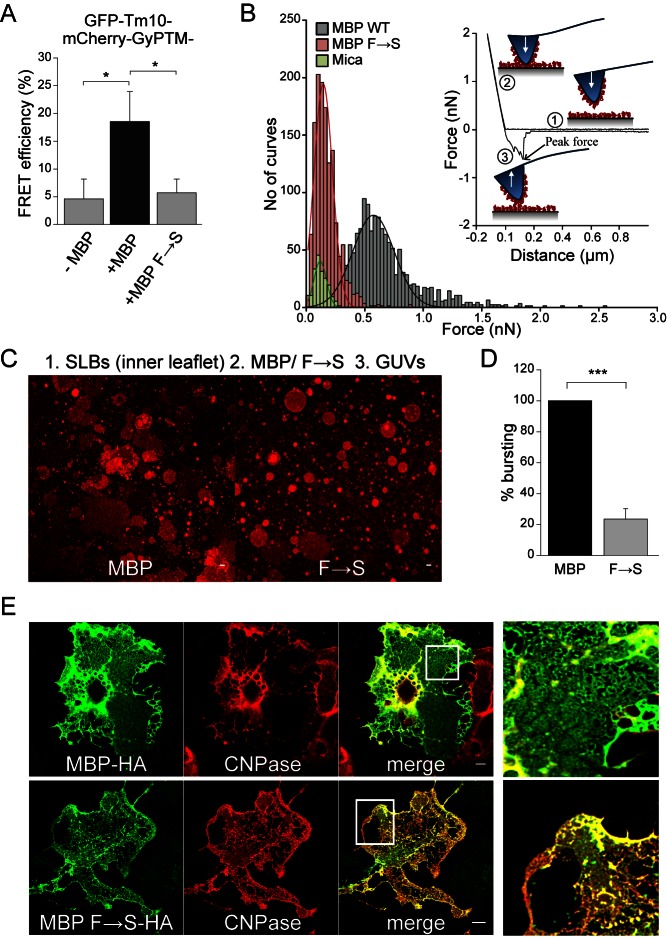
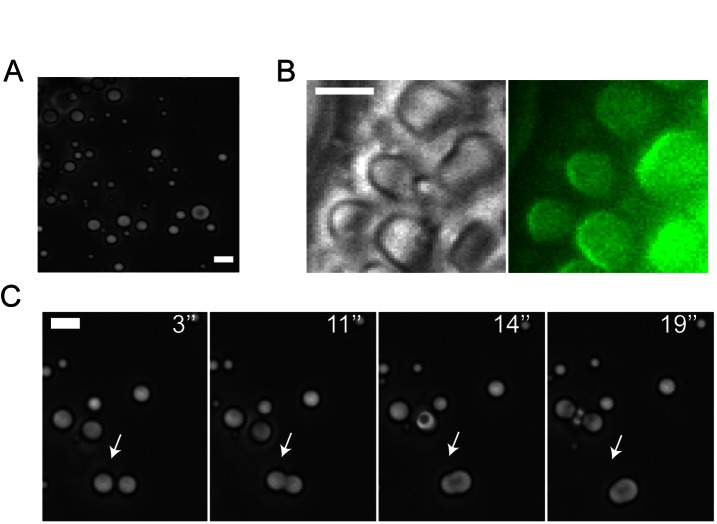
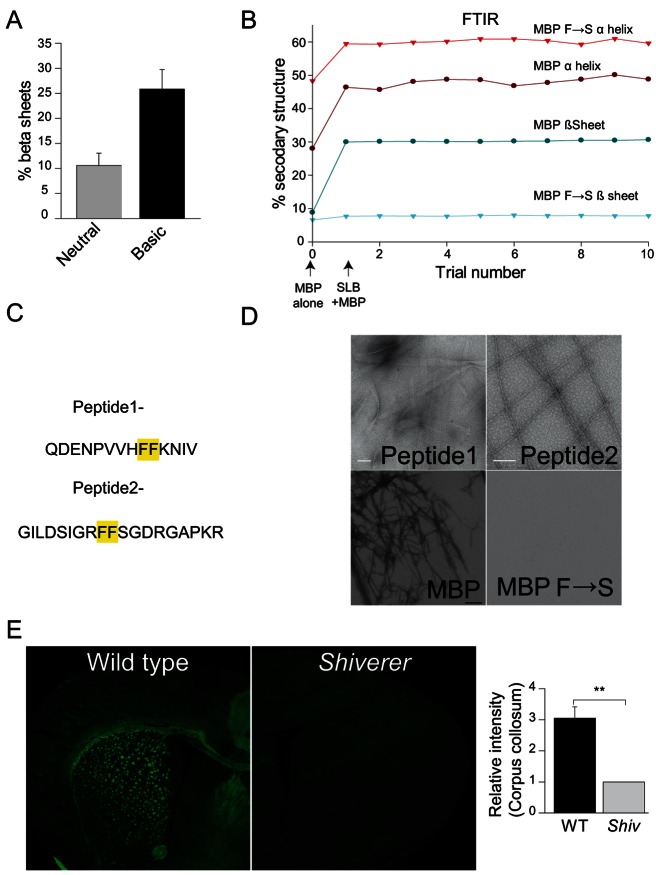
Rapid conduction of nerve impulses requires coating of axons by myelin. To function as an electrical insulator, myelin is generated as a tightly packed, lipid-rich multilayered membrane sheath. Knowledge about the mechanisms that govern myelin membrane biogenesis is required to understand myelin disassembly as it occurs in diseases such as multiple sclerosis. Here, we show that myelin basic protein drives myelin biogenesis using weak forces arising from its inherent capacity to phase separate. The association of myelin basic protein molecules to the inner leaflet of the membrane bilayer induces a phase transition into a cohesive mesh-like protein network. The formation of this protein network shares features with amyloid fibril formation. The process is driven by phenylalanine-mediated hydrophobic and amyloid-like interactions that provide the molecular basis for protein extrusion and myelin membrane zippering. These findings uncover a physicochemical mechanism of how a cytosolic protein regulates the morphology of a complex membrane architecture. These results provide a key mechanism in myelin membrane biogenesis with implications for disabling demyelinating diseases of the central nervous system.


Conflict of interest statement

The authors have declared that no competing interests exist.

Figures

Figure 1
Figure 1. MBP drives protein extrusion.
(A) Depletion of CNPase from myelin membrane sheets over time. Scale bar, 10 µm. (B) Quantification of the percentage of cell area occupied by the indicated proteins at different stages of development. MOG, a protein that localizes to the compacted myelin sheets, is shown as a control. Bars show mean ± SD (n = 20, *p<0.05, ANOVA). (C) In vivo localization of CNPase in the myelin sheaths of optic nerves at P14 and P21. Scale bar, 500 nm. Quantification for percentage of total labeling of CNPase in inner tongue and between the inner and outer tongue. Bars show mean of 100 myelinated axons. (D) Schematic representation of the ER-PM assay in PtK2 cells. The cytoplasmic domain of an integral membrane protein is replaced by MBP (GFP-TM-MBP). GFP is fused to the N-terminus for visualization. Upon expression in PtK2 cells, the fusion protein forms sheet-like ER-plasma membrane contact sites. (E, F) Visualization of surface glycoproteins using fluorophore-conjugated lectins: concanavalin A (ConA) and wheat WGA in PtK2 cells expressing mCherry-TM-MBP. Scale bar, 10 µm. Most glycoproteins are depleted from the patches as shown by the intensity profile plots for the indicated lectins along the marked lines in the merged images.
Figure 2
Figure 2. Low mobility of MBP domains.
(A) Schematic representation of the reporter construct used to measure mobility of MBP in primary oligodendrocytes. (B) Dendra2 was fused to the N-terminus of either TM (Dendra2-TM) or TM-MBP (Dendra2-TM-MBP) and expressed in primary oligodendrocytes. A squared region of interest was photoconverted from green-to-red via excitation with 405 nm laser. The decay of signal in the photoconveted region of interest was measured over time. Decay of photoconverted signal with time is shown in the representative, zoomed-in images for primary oligodendrocyte cultures expressing either Dendra2-TM or Dendra2-TM-MBP. Scale bar, 10 µm. (C) Curves depict the decay of signal over time for the indicated constructs. (D) Average decay after photoconversion. Bars represent mean ± SEM (n = 3, **p<0.01, t test). (E) Fluorescence recovery was monitored in primary cells expressing GFP-TM or GFP-TM-MBP after bleaching a squared region of interest. Recovery curves are presented in the form of graphs. (F) Average recovery after photobleaching. Bars represent mean ± SEM (n = 3, ***p<0.001, t test). (G) Dendra2 was fused to the N-terminus of either TM (Dendra2-TM) or TM-MBP (Dendra2-TM-MBP) and expressed in PtK2 cells. A squared region of interest was photoconverted from green-to-red via excitation with 405 nm laser. The decay of signal in the photoconveted region of interest was measured over time. Decay of photoconverted signal with time is shown in the representative, zoomed-in images for PtK2 cells expressing either Dendra2-TM or Dendra2-TM-MBP. Scale bar, 10 µm. (H) The decay of signal is presented in the form of curves. (I) Average decay after photoconversion. Bars represent mean ± SEM (n = 3, **p<0.01, t test). (J) Fluorescence recovery was monitored in PtK2 cells expressing GFP-TM or GFP-TM-MBP after bleaching a squared region of interest. Recovery curves are presented in the form of graphs. (K) Average recovery after photobleaching. Bars represent mean ± SEM (n = 3, ***p<0.001, t test).
Figure 3
Figure 3. The F→S mutant of MBP loses its ability for protein extrusion, but not for membrane binding.
(A) Sequence of the 14 kDa isoform of MBP showing positions of phenylalanine residues that are mutated to serines in the F→S mutant. (B) Distribution of cell surface glycoproteins as visualized by fluorophore-conjugated ConA staining in PtK2 cells expressing mCherry-TM-MBP or mCherry-TM-MBP F→S. Enlarged view of the selected regions in merged images is shown on the right side. (C) Assessment of plasma membrane distribution of soluble MBP and MBP F→S in Oli-neu cells, an oligodendroglial precursor cell line. Scale bar, 10 µm. Relative intensity profile plots along the plasma membrane is shown on the right side (n = 20 cells). (D) Typical images of SLBs (with the inner myelin leaflet lipid composition) stained for MBP after incubation with 7 µM of either purified wild-type (MBP) or mutant (MBP F→S). Scale bar, 10 µm. (E) Western blot analysis of supernatant (S) and pellet (P) fractions after incubation of LUVs (large unilamellar vesicles with the inner myelin leaflet lipid composition) with either 3.5 µM of WT MBP, MBP F→S, or recombinant GFP.
Figure 4
Figure 4. Self-association of MBP molecules via hydrophobic interactions is required for its function.
(A) Quantification of FRET efficiency in PtK2 cells expressing GFP-Tm10 (Donor) and mCherry-GyPTM (Acceptor) both harboring at the C-terminal end either wild-type MBP or MBP F→S. While Tm10 represents the transmembrane domain of Tmem10, GyPTM represents the mutated monomeric transmembrane domain of the glycophorin protein. Bars indicate mean ± SD (n = 20 cells, *p<0.05, ANOVA). (B) Comparison of interaction forces between wild-type MBP or F→S mutant molecules pre-adsorbed, both to the mica surface and AFM tip. Inset shows the schematic depiction of shape of the curve as cantilever tip approaches the sample surface (1), as tip touches the surface (2), and as tip is retracted from the sample surface (3). Histogram of peak force measured for MBP (black), MBP F→S (red), and buffer (green). (C) Representative images of a biomimetic assay in which MBP or MBP F→S is sandwiched between SLBs (inner myelin leaflet lipid composition) and GUVs (PC∶PS in 3∶1 mole%). Scale bar, 10 µm. (D) Quantification of percentage GUV bursting. Bars show mean ± SEM (n = 3 experiments, ***p<0.001, t test). (E) Shiverer cells at 0 DIV were infected with AAV2 viral particles expressing either wild-type MBP (MBP-HA) or F→S mutant (MBP F→S-HA) containing a C-terminal HA-tag. At 6 DIV, cells were immunostained for CNPase and the HA tags. Expression of MBP-HA induces the depletion of CNPase from regions within the sheets, whereas the F→S mutant fails in extruding CNPase despite entering the sheets of shiverer cells. Enlarged view of the selected regions in merged images is shown on the right side. Scale bar, 10 µm.
Figure 5
Figure 5. Phase transition of wild-type, but not the F→S mutant of MBP.
(A) In basic solution MBP (5 mg/mL) forms droplets as visualized by phase contrast microscopy. (B) Droplets contain Atto-488-labeled MBP (5 mg/mL) as visualized by wide field (right panel) microscopy. (C) Time-lapse images of two merging droplets. Scale bar, 5 µm.
Figure 6
Figure 6. β-sheet structure mediates amyloid-like self-assembly of MBP.
(A) Secondary structure determination from FTIR spectroscopy of wild-type MBP in the presence of 20 mM NaOH. Bars represent range from two independent experiments. (B) Secondary structure determination of wild-type and the F→S mutant after addition to the SLBs with the inner myelin leaflet lipid composition. (C) Aggregation-prone stretches within MBP sequence. (D) Transmission electron microscopy of peptide 1 and peptide 2 (left and middle panel) incubated in 25 mM HEPES (pH 7.5), 150 mM KCl, and 0.5 mM MgCl2 for several days. The lower panel shows the fibrillar aggregates obtained in 20 mM HCl, 500 mM Na2SO4, and 5% ethanol for wild-type MBP, but not the MBP F→S mutant. (E) Thioflavin S staining of P18 MBP deficient shiverer and wild-type mice brain. Quantification of relative fluorescent intensity in corpus collosum. Bars show mean ± SEM (n = 3 animals, **p<0.01, t test).

Similar articles

Cited by

References

    1. Hyman AA, Simons K (2012) Beyond oil and water-phase transitions in cells. Science 337: 1047–1049. - PubMed
    1. Weber Stephanie C, Brangwynne Clifford P (2012) Getting RNA and protein in phase. Cell 149: 1188–1191. - PubMed
    1. Brangwynne CP, Eckmann CR, Courson DS, Rybarska A, Hoege C, et al. (2009) Germline P granules are liquid droplets that localize by controlled dissolution/condensation. Science 324: 1729–1732. - PubMed
    1. Kato M, Han Tina W, Xie S, Shi K, Du X, et al. (2012) Cell-free formation of RNA granules: low complexity sequence domains form dynamic fibers within hydrogels. Cell 149: 753–767. - PMC - PubMed
    1. Emery B (2010) Regulation of oligodendrocyte differentiation and myelination. Science 330: 779–782. - PubMed

Publication types

MeSH terms

LinkOut - more resources