Clinical Trial
. 2013;9(6):e1003407.
doi: 10.1371/journal.ppat.1003407. Epub 2013 Jun 6.

Vitamin D induces interleukin-1β expression: paracrine macrophage epithelial signaling controls M. tuberculosis infection

Affiliations
Clinical Trial

Vitamin D induces interleukin-1β expression: paracrine macrophage epithelial signaling controls M. tuberculosis infection

Mark Verway et al. PLoS Pathog. 2013.

Abstract

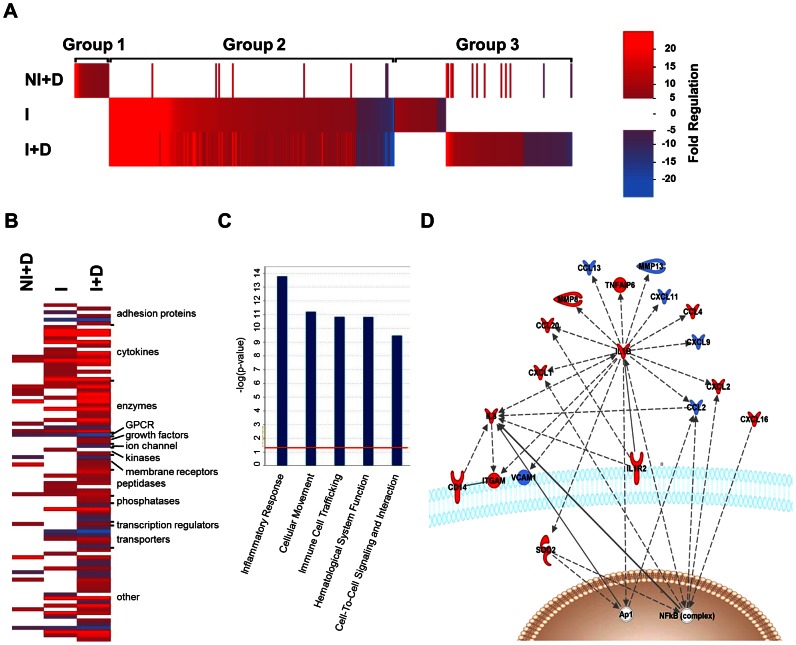
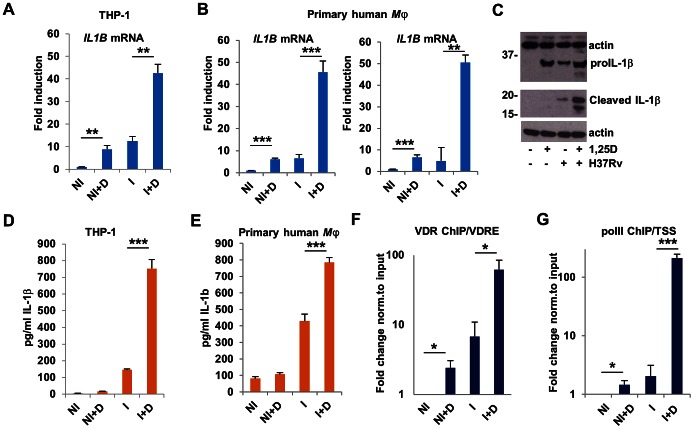
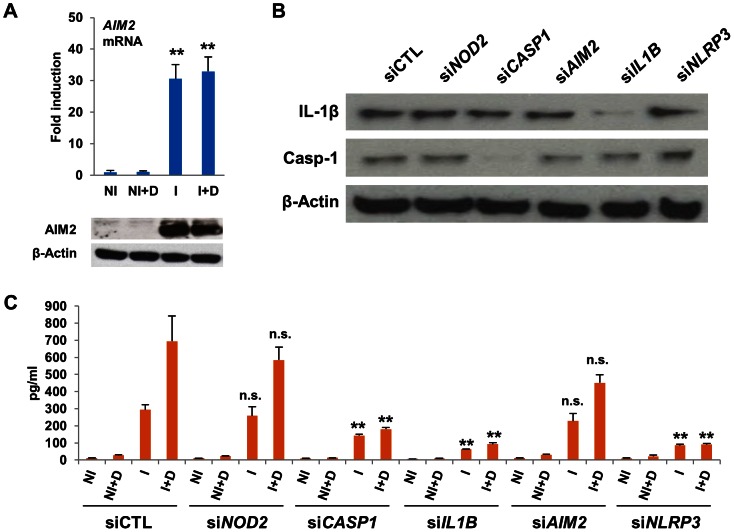
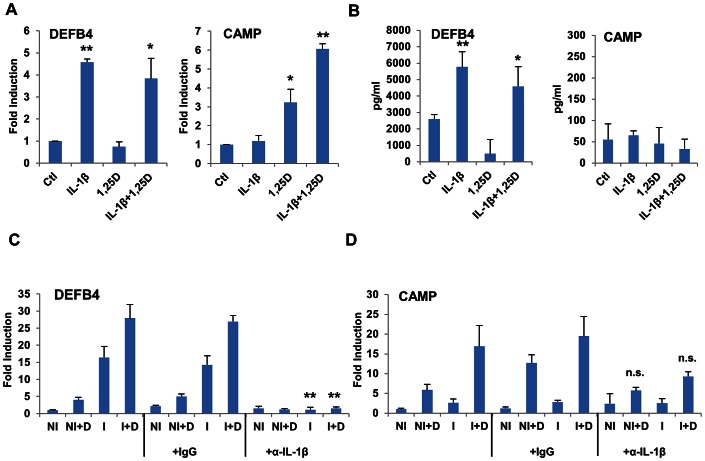
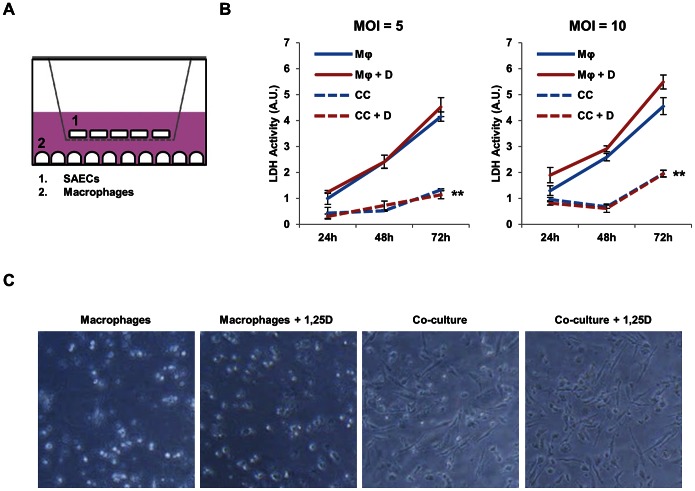
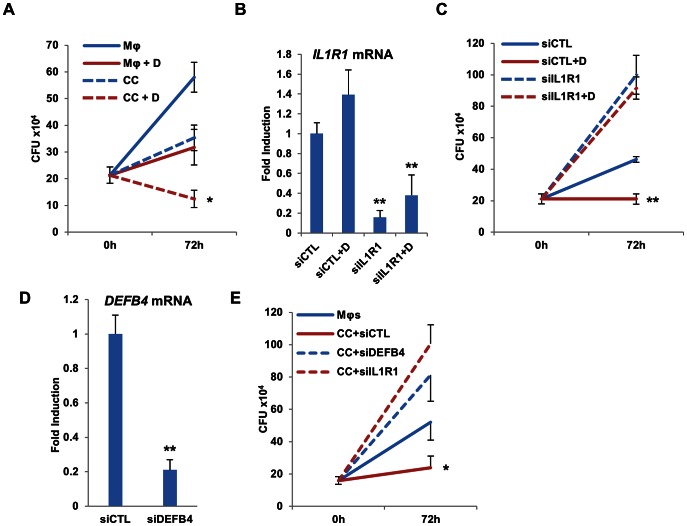
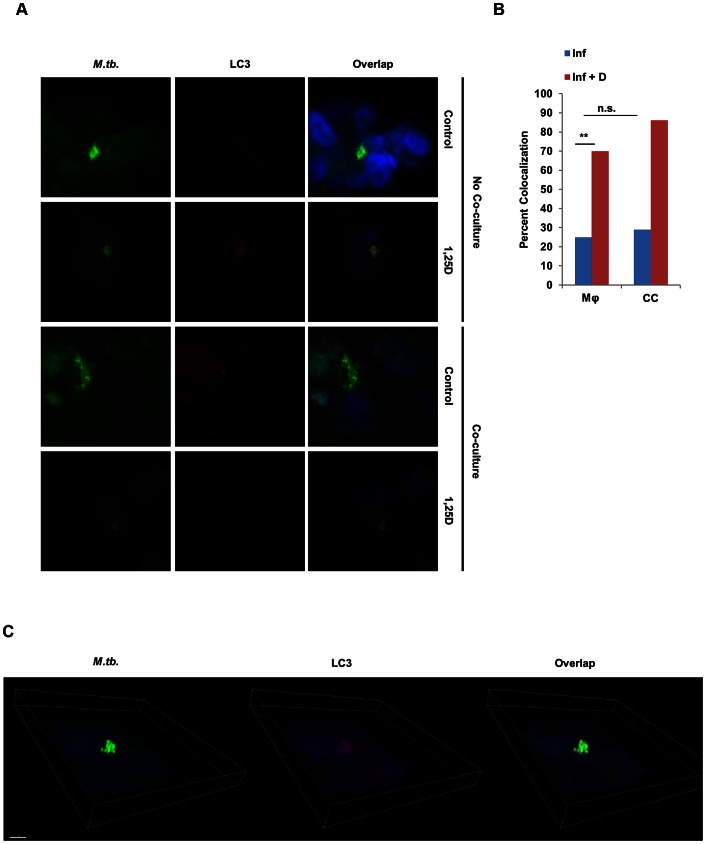
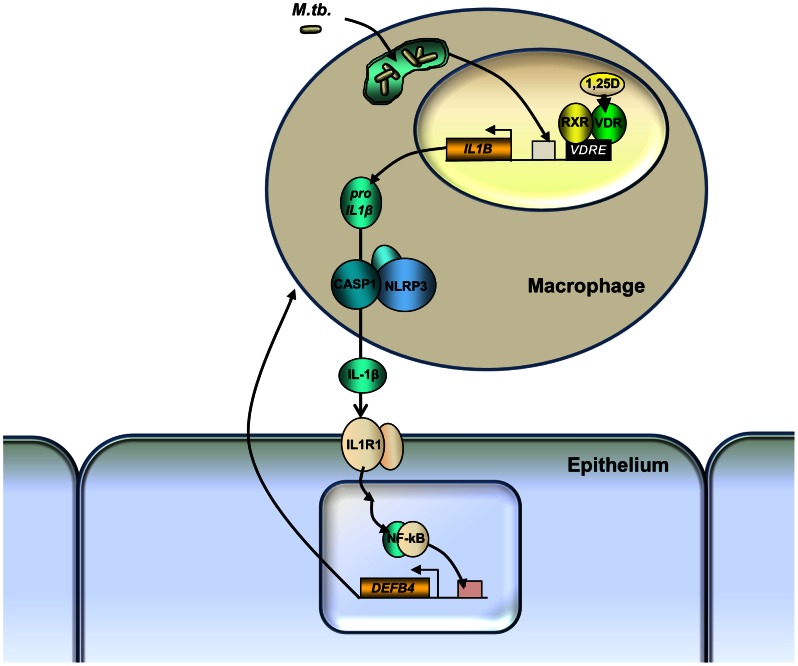
Although vitamin D deficiency is a common feature among patients presenting with active tuberculosis, the full scope of vitamin D action during Mycobacterium tuberculosis (Mtb) infection is poorly understood. As macrophages are the primary site of Mtb infection and are sites of vitamin D signaling, we have used these cells to understand the molecular mechanisms underlying modulation of the immune response by the hormonal form of vitamin D, 1,25-dihydroxyvitamin D (1,25D). We found that the virulent Mtb strain H37Rv elicits a broad host transcriptional response. Transcriptome profiling also revealed that the profile of target genes regulated by 1,25D is substantially altered by infection, and that 1,25D generally boosts infection-stimulated cytokine/chemokine responses. We further focused on the role of 1,25D- and infection-induced interleukin 1β (IL-1β) expression in response to infection. 1,25D enhanced IL-1β expression via a direct transcriptional mechanism. Secretion of IL-1β from infected cells required the NLRP3/caspase-1 inflammasome. The impact of IL-1β production was investigated in a novel model wherein infected macrophages were co-cultured with primary human small airway epithelial cells. Co-culture significantly prolonged survival of infected macrophages, and 1,25D/infection-induced IL-1β secretion from macrophages reduced mycobacterial burden by stimulating the anti-mycobacterial capacity of co-cultured lung epithelial cells. These effects were independent of 1,25D-stimulated autophagy in macrophages but dependent upon epithelial IL1R1 signaling and IL-1β-driven epithelial production of the antimicrobial peptide DEFB4/HBD2. These data provide evidence that the anti-microbial actions of vitamin D extend beyond the macrophage by modulating paracrine signaling, reinforcing its role in innate immune regulation in humans.


Conflict of interest statement

The authors have declared that no competing interests exist.

Figures

Figure 1
Figure 1. 1,25D alters the host macrophage transcriptomic response to Mtb infection.
(A) Intensity heat map of genes regulated 5-fold or more during infection in the absence or presence of 1,25D. THP-1 cells were either not infected (NI) or infected with H37Rv (I) and treated with vehicle (DMSO) or 100 nM 1,25D (+D) for 24 hours. Each vertical line represents one gene that was either up-regulated (red), down-regulated (blue) or not affected (white) under each of the conditions relative to uninfected cells not treated with 1,25D, as indicated in the scale. Group 1 represents those genes that were only detected in the NI+D condition, group 2 were those genes that were commonly expressed in both infected conditions, and group 3 represents those genes that were expressed in only one of the infected conditions as a result of 1,25D treatment. (B) Functional clustering heat map of genes selected for a >5-fold change in either the I or I+D condition relative to the NI control as well as having a >1.5-fold difference between the two. Increasing brightness for red and blue denote up- and down-regulation respectively. (C) Highest-rated functions associated with relative expression of I+D/I in genes from B, with a Fisher's exact test p-value threshold set at 0.01 (red line) using Ingenuity Pathways Analysis (IPA) software. (D) Network clustering analysis of genes from B using IPA software. Solid and hashed lines denote known direct and indirect actions between two proteins as determined by IPA. Red and blue denote relative up- or down-regulation of their expression in the I+D condition as compared to the I condition, respectively. Data is derived from analysis of Affymetrix Human Gene 1.0ST microarray chips. mRNA samples for analysis were prepared in triplicate, and data presented is representative of two independent replicates.
Figure 2
Figure 2. 1,25D directly regulates IL-1β expression in Mtb-infected macrophages.
(A) Expression of IL1B transcripts as assessed by RT/qPCR in control or H37Rv-infected THP-1 cells 24 hours after infection. Data are normalized to the uninfected, untreated control (NI, uninfected cells; NI+D, uninfected cells treated with 1,25D; I, H37Rv-infected cells; I+D, infected cells treated with 1,25D). (B) Expression of IL1B transcripts in two independent cultures of H37Rv-infected primary human macrophages, analyzed as in A. (C) Protein expression and processing of IL-1β in uninfected and infected THP-1 cells. (D) Secretion of IL-1β from uninfected and infected THP-1 cells. (E) Secretion of IL-1β from uninfected and infected primary human macrophages. (F) ChIP analysis of association of the VDR with the IL1B VDRE and transcription start site (TSS). (G) ChIP analysis of recruitment of the large subunit of RNA PolII to the VDRE and TSS of the IL1B gene. ChIP values are normalized to input for each condition and expressed as a fold relative to non-specific IgG control. All data are from one experiment and representative of at least three independent experiments (n = 3, mean, s.d.). *P<0.05, **P<0.01, ***P<0.001 as determined by Student's t-test.
Figure 3
Figure 3. 1,25D-induced IL-1β secretion requires NLRP3.
(A) Expression of AIM2 transcripts and protein in control and infected cells 24 hours after infection. (NI, uninfected cells; NI+D, uninfected cells treated with 1,25D; I, H37Rv-infected cells; I+D, infected cells treated with 1,25D). Values are expressed as fold relative to NI. (B) Western blots of pro-IL-1β, caspase-1, and β-actin from THP-1 cells transfected with siRNAs indicated and infected for 24 hours with H37Rv. C. IL-1β secretion from uninfected (NI) or infected (I) THP-1 cells transfected with siRNAs indicated. 1,25D (D) was added as indicated. All data are from one experiment and representative of at least three independent experiments (n = 3, mean, s.d.). **P<0.01 as determined by Student's t-test relative uninfected (A) or respective siCTL (C) control.
Figure 4
Figure 4. DEFB4 and CAMP genes are regulated by IL-1β and 1,25D in SAECs.
(A) Expression of DEFB4 and CAMP in SAECs as measured by RT/qPCR. Cells were incubated with IL-1β (10 ng/ml) or 1,25D (100 nM) for 24 h. (B) Media supernatants from cells in (A) were tested for DEFB4 and LL-37 protein secretion by ELISA. (C) and (D) Expression of DEFB4 (C) and CAMP (D) genes in SAECs incubated with conditioned media from uninfected (NI) or H37Rv-infected (I) THP-1 cells treated with vehicle or 100 nM 1,25D (+D) for 24 hours. Media was treated with neutralizing antibody against IL-1β (α-IL-1β), or normal serum IgG, as indicated, for 30 minutes prior to incubation with cells. Values are expressed as a fold of the NI control. All data are from one experiment and representative of three independent experiments using separate donors of SAECs (n = 3, mean, s.d.). *P<0.05, **P<0.01 as determined by Student's t-test relative untreated (A, B) or respective IgG (C) control.
Figure 5
Figure 5. Co-culture with SAECs enhances survival of Mtb-infected macrophages.
(A) Schematic representation in profile of co-culture system. THP-1 cells were cultured and infected in the lower well and SAECs were seeded in the upper transwell bucket. (B) LDH activity measured in the media supernatant from macrophages (Mφ) infected with H37Rv at an MOI of 5 or 10, as indicated, and treated with vehicle control or 100 nM 1,25D (+D), with and without the presence of SAECs in transwell co-culture (CC). Signal was normalized to spontaneous LDH release levels from uninfected macrophages, as measured from media supernatant collected from cells at each day. All data is expressed relative to LDH activity of the Mφ condition infected at an MOI of 5 at 24 hours post-infection. Data are from one experiment and representative of two independent experiments using separate donors of SAECs (n = 3, mean, s.d.). **P<0.01 as determined by two-way ANOVA comparing Mφ to CC conditions. (C) Representative phase-contrast microscopy of macrophages 3 days after infection with and without 1,25D treatment in the presence or absence of SAECs in co-culture. In the macrophage only condition, most of the cells visible appear round and out of focus as they are floating freely in the media, while cells co-cultured with SAECs are almost all adherent and exhibit normal macrophage morphology.
Figure 6
Figure 6. Control of Mtb infection by co-cultured epithelial cells is dependent on epithelial IL1R1 and DEFB4 expression.
(A) CFU of macrophages (Mφ) infected with H37Rv at an MOI of 5 for 4 hours and treated with vehicle control or 100 nM 1,25D (+D), with and without the additional presence of SAECs in transwell co-culture (CC). Data are from three experimental replicates (mean and SD) and representative of three independent experiments using different donors of primary cells. Statistical significance was determined by one-way ANOVA. (*P<0.05). (B) Validation of siRNA-mediated knockdown of IL1R1 expression in SAECs. RNA was extracted from SAECs cells 3 days after the initiation of co-culture and 4.5 days after transfection of control siRNA (siCTL) or siIL1R1. Data are from three experimental replicates (mean and SD), **P<0.01 as determined by student's T-test relative to respective siCTL controls. (C) CFU quantification of Mtb in THP-1 cells infected at an MOI of 5 for 4 hours after 72 hours of co-culture with SAEC cells transfected with control siRNA (siCTL) or siRNA specific to IL1R1. 1,25D (D) was added as indicated. Data are from three experimental replicates (mean and SD) and representative of two independent experiments. Statistical significance was determined by one-way ANOVA. (**P<0.01). (D) Validation of siRNA-mediated knockdown of DEFB4 expression in SAECs. RNA was extracted from SAECs cells 3 days after the initiation of co-culture and 4.5 days after transfection of control siRNA (siCTL) or siDEFB4. Data are from three experimental replicates (mean and SD) and representative to two independent replicates. **P<0.01 as determined by student's T-test relative to siCTL control. (E) CFU quantification of Mtb in THP-1 cells infected at an MOI of 5 for 4 hours after 72 hours of co-culture with SAEC cells transfected with control siRNA (siCTL) or siRNA specific to IL1R1 or DEFB4. Data are from three experimental replicates (mean and SD) and representative of two independent experiments using separate donors of SAECs. Statistical significance was determined by one-way ANOVA. (*P<0.05).
Figure 7
Figure 7. Co-culture with SAECs does not enhance autophagy in Mtb-infected macrophages.
(A) Representative bright-field microscopy of infected macrophages cultured in the absence or presence of 1,25D and/or a transwell containing SAECs. Cells were fixed and probed with an antibody against Mtb, LC3, and the nuclear stain DAPI. (B) Percent of Mtb that colocalized with LC3 signal under each condition as determined by counting populations of infected macrophages across at least 10 confocal images, with at least two infected cells per image. Statistical significance was determined by a two-tailed Fisher's exact test (**P<0.01). (C) 3-dimensional rendering of confocal stacks of infected macrophages treated with 1,25D to demonstrate colocalization of LC3 and Mtb signal.
Figure 8
Figure 8. Model of paracrine macrophage-epithelial cell signaling cascade driven by 1,25D and IL-1β.
IL1B gene expression is driven by infection and 1,25D, and pro-IL-1β maturation is dependent on the NLRP3 inflammasome. Released IL-1β signals via IL1R1 on adjacent epithelial cells to induce expression of DEFB4. The release of DEFB4 induced by IL-1β, in combination with 1,25D, leads to control of mycobacterial proliferation in the macrophage.

Similar articles

Cited by

References

    1. Dye C (2006) Global epidemiology of tuberculosis. The Lancet 367: 938–940. - PubMed
    1. Keeler E, Perkins MD, Small P, Hanson C, Reed S, et al. (2006) Reducing the global burden of tuberculosis: the contribution of improved diagnostics. Nature 444 Suppl 1: 49–57. - PubMed
    1. Marks SM, Taylor Z, Qualls NL, Shrestha-Kuwahara RJ, Wilce MA, et al. (2000) Outcomes of contact investigations of infectious tuberculosis patients. American Journal of Respiratory and Critical Care Medicine 162: 2033–2038. - PMC - PubMed
    1. Holt PG, Strickland DH, Wikstrom ME, Jahnsen FL (2008) Regulation of immunological homeostasis in the respiratory tract. Nat Rev Immunol 8: 142–152. - PubMed
    1. Li Y, Wang Y, Liu X (2012) The Role of Airway Epithelial Cells in Response to Mycobacteria Infection. Clinical and Developmental Immunology 2012: 11. - PMC - PubMed

Publication types

MeSH terms