. 2013:2013:648291.
doi: 10.1155/2013/648291. Epub 2013 May 9.

Modeling the spread of tuberculosis in semiclosed communities

Affiliations

Modeling the spread of tuberculosis in semiclosed communities

Mauricio Herrera et al. Comput Math Methods Med. 2013.

Abstract

We address the problem of long-term dynamics of tuberculosis (TB) and latent tuberculosis (LTB) in semiclosed communities. These communities are congregate settings with the potential for sustained daily contact for weeks, months, and even years between their members. Basic examples of these communities are prisons, but certain urban/rural communities, some schools, among others could possibly fit well into this definition. These communities present a sort of ideal conditions for TB spread. In order to describe key relevant dynamics of the disease in these communities, we consider a five compartments SEIR model with five possible routes toward TB infection: primary infection after a contact with infected and infectious individuals (fast TB), endogenous reactivation after a period of latency (slow TB), relapse by natural causes after a cure, exogenous reinfection of latently infected, and exogenous reinfection of recovered individuals. We discuss the possible existence of multiple endemic equilibrium states and the role that the two types of exogenous reinfections in the long-term dynamics of the disease could play.


Figures

Figure 1
Figure 1
Flow chart of TB compartmental model.
Figure 2
Figure 2
Bifurcation diagram (solution x of polynomial (20) versus β) for the condition β R0 < β C < β B. β R0 is the bifurcation value. The blue branch in the graph is a stable endemic equilibrium which appears for R 0 > 1.
Figure 3
Figure 3
Polynomial P(x) for different values of β with the condition β B < β R0 < β C. The graphs were obtained for values of δ = 3.0 and η = 2.2. The dashed black line indicates the case β = β R0. The figure shows the existence of multiple equilibria.
Figure 4
Figure 4
Bifurcation diagram for the condition β B < β C < β R0. β* is the bifurcation value. The blue branch in the graph is a stable endemic equilibrium which appears even for R 0 < 1.
Figure 5
Figure 5
Numerical simulation for R 0 = 3.585422172, δ = 0.9, η = 0.01, and β = 0.00052. The system goes toward a focus type stable stationary equilibrium.
Figure 6
Figure 6
Phase space representation of the evolution of the system toward a stable focus type equilibrium. In this representation were used multiple initial conditions and the following values: R 0 = 3.585422172, δ = 0.9, η = 0.01, and β = 0.00052.
Figure 7
Figure 7
Numerical simulation for R 0 = 3.585422172, δ = 0.01, η = 0.9, and β = 0.00052. In this case the system converges to a stable node type equilibrium.
Figure 8
Figure 8
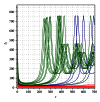
Numerical simulation for R 0 = 0.9653059690, δ = 3.0, and η = 2.5. The system can evolve to two different equilibria I I∞ = 0 (red lines) or I I∞ = 285 (dark green lines) according to different initial conditions.
Figure 9
Figure 9
Numerical simulation for R 0 = 0.9653059690, δ = 3.0, and η = 2.5. Phase space representation of the system with multiple equilibrium points.
Figure 10
Figure 10
Bifurcation diagram (solution x of polynomial (20) versus β) for the condition β B < β R0 < β C. The system experiences multiple bifurcations at β 1, β R0, and β 2.
Figure 11
Figure 11
Numerical simulation for R 0 = 0.9972800211, δ = 3.0, and η = 2.5. The system can evolve to two different equilibria I I∞ = 0 or I I∞ = 190 according to the initial condition.
Figure 12
Figure 12
Numerical simulation for R 0 = 0.9972800211, δ = 3.0, and η = 2.5. Phase space representation of the system with multiple equilibrium points.
Figure 13
Figure 13
Numerical simulation for R 0 = 1.002043150, δ = 3.0, and η = 2.5. The system can evolve to two different equilibria P 1 (stable node) or P 3 (stable focus) according to the initial condition. P 0 and P 2 are unstable equilibria.
Figure 14
Figure 14
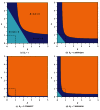
Signs of coefficients B and C as functions of exogenous reinfection rate of latent δ and exogenous reinfection rate of recovered η for R 0⩾1. The parameter β has the values: (a) β = β R0 = 0.0001450317354, (b) β = 0.0002450317354, (c) β = 0.0003450317354, and (d) β = 0.001145031735.
Figure 15
Figure 15
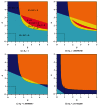
Signs of coefficients B, C, and discriminant Δ = B 2 − 3AC as functions of exogenous reinfection rate of latent δ and exogenous reinfection rate of recovered η for R 0⩾1. The parameter β has the values: (a) β = β R0 = 0.0002277727471, (b) β = 0.0002287727471, (c) β = 0.0002477727471, and (d) β = 0.0005277727471.
Figure 16
Figure 16
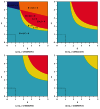
Signs of coefficients B, C, and discriminant Δ = B 2 − 3AC as functions of exogenous reinfection rate of latent δ and exogenous reinfection rate of recovered η for R 0⪕1. The parameter β has the values: (a) β = 0.0002177727471, (b) β = 0.0002027727471, (c) β = 0.0001777727471, and (d) β = 0.0001277727471.

References

    1. Castillo-Chavez C, Song B. Dynamical models of tuberculosis and applications. Mathematical Biosciences and Engineering. 2004;1:361–404. - PubMed
    1. Ozcaglar C, Shabbeer A, Vandenberg SL, Yener B, Bennett KP. Epidemiological models of Mycobacterium tuberculosis complex infections. Mathematical Biosciences. 2012;236:77–96. - PMC - PubMed
    1. Raffalli J, Sepkowitz KA, Armstrong D. Community-based outbreaks of tuberculosis. Archives of Internal Medicine. 1996;156(10):1053–1060. - PubMed
    1. Basu S, Stuckle D, McKee M. Addressing institutional amplifiers in the dynamics and control of tuberculosis epidemics. The American Journal of Tropical Medicine and Hygiene. 2011;84(1):30–37. - PMC - PubMed
    1. Chiang CY, Riley LW. Exogenous reinfection in tuberculosis. The Lancet Infectious Diseases. 2005;5(10):629–636. - PubMed

Publication types

MeSH terms

LinkOut - more resources