. 2013 Jun 6;8(6):e62692.
doi: 10.1371/journal.pone.0062692. Print 2013.

DNA qualification workflow for next generation sequencing of histopathological samples

Affiliations

DNA qualification workflow for next generation sequencing of histopathological samples

Michele Simbolo et al. PLoS One. .

Abstract

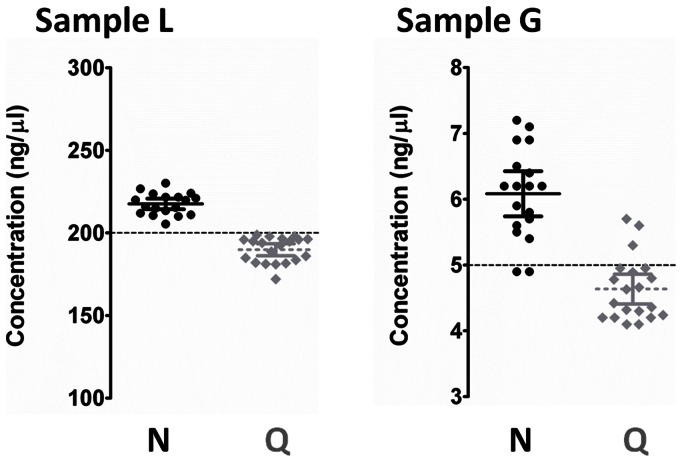
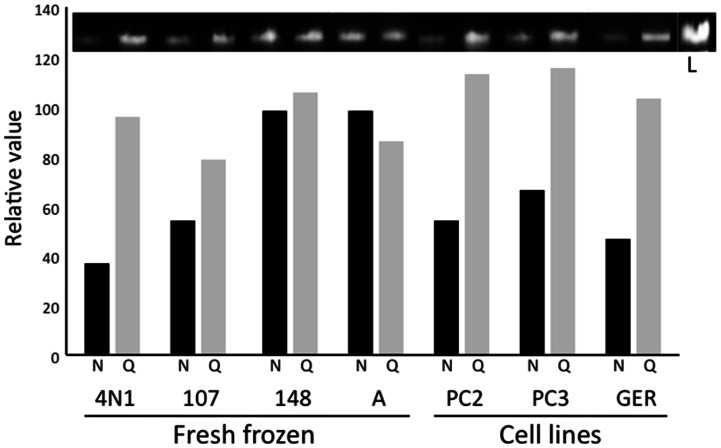
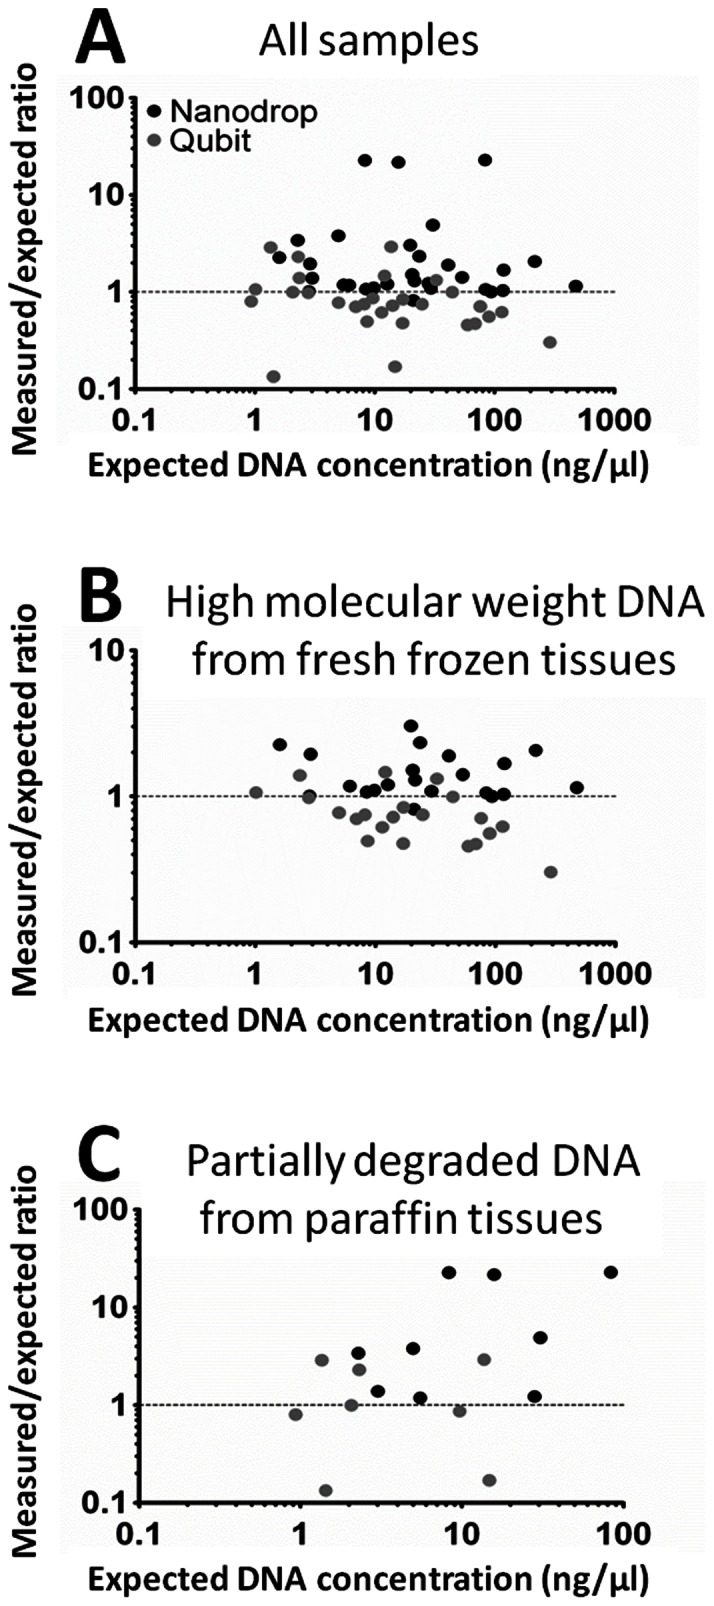
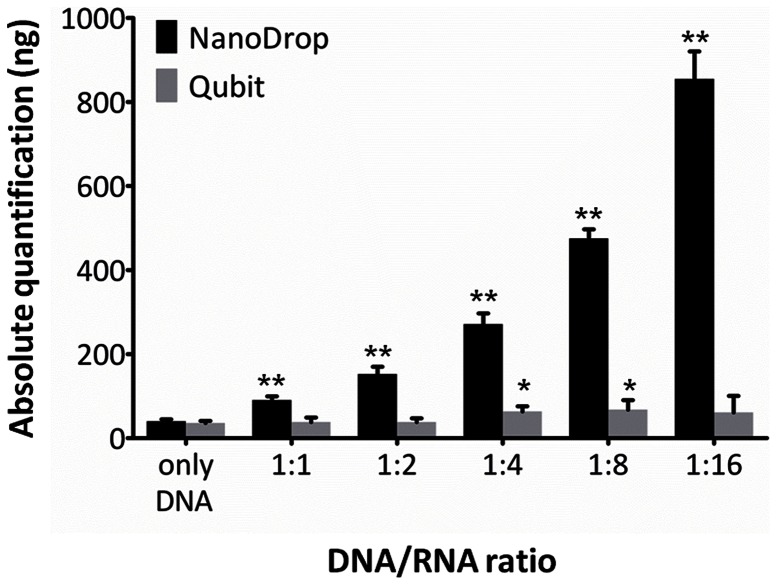
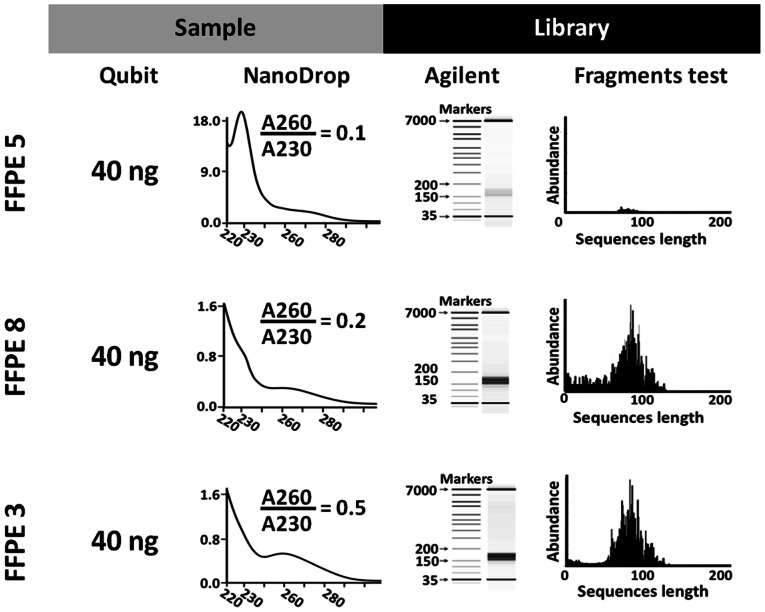
Histopathological samples are a treasure-trove of DNA for clinical research. However, the quality of DNA can vary depending on the source or extraction method applied. Thus a standardized and cost-effective workflow for the qualification of DNA preparations is essential to guarantee interlaboratory reproducible results. The qualification process consists of the quantification of double strand DNA (dsDNA) and the assessment of its suitability for downstream applications, such as high-throughput next-generation sequencing. We tested the two most frequently used instrumentations to define their role in this process: NanoDrop, based on UV spectroscopy, and Qubit 2.0, which uses fluorochromes specifically binding dsDNA. Quantitative PCR (qPCR) was used as the reference technique as it simultaneously assesses DNA concentration and suitability for PCR amplification. We used 17 genomic DNAs from 6 fresh-frozen (FF) tissues, 6 formalin-fixed paraffin-embedded (FFPE) tissues, 3 cell lines, and 2 commercial preparations. Intra- and inter-operator variability was negligible, and intra-methodology variability was minimal, while consistent inter-methodology divergences were observed. In fact, NanoDrop measured DNA concentrations higher than Qubit and its consistency with dsDNA quantification by qPCR was limited to high molecular weight DNA from FF samples and cell lines, where total DNA and dsDNA quantity virtually coincide. In partially degraded DNA from FFPE samples, only Qubit proved highly reproducible and consistent with qPCR measurements. Multiplex PCR amplifying 191 regions of 46 cancer-related genes was designated the downstream application, using 40 ng dsDNA from FFPE samples calculated by Qubit. All but one sample produced amplicon libraries suitable for next-generation sequencing. NanoDrop UV-spectrum verified contamination of the unsuccessful sample. In conclusion, as qPCR has high costs and is labor intensive, an alternative effective standard workflow for qualification of DNA preparations should include the sequential combination of NanoDrop and Qubit to assess the purity and quantity of dsDNA, respectively.


Conflict of interest statement

Competing Interests: Co-author Aldo Scarpa is a PLOS ONE Editorial Board member; this does not alter the authors' adherence to all the PLOS ONE policies on sharing data and materials.

Figures

Figure 1
Figure 1. Intra- and inter-method accuracy and precision.
Distribution of DNA sample concentration (dispersion chart) was estimated by both NanoDrop (black) and Qubit (gray) on repeated (n = 20) measurements of two commercial human genomic DNA preparations (Sample L 200 ng/µl; Sample G 5 ng/µl). For both samples, NanoDrop overestimated the DNA concentration (+8.8% for L and +24.0% for G, p<0.0003), while Qubit underestimated it (−5.0% for L and −7.3% for G, p<0.005).
Figure 2
Figure 2. Significant discrepancies in DNA quantification by NanoDrop and Qubit.
A total of 100 ng of DNA based on NanoDrop (N, black bars) or Qubit (Q, grey bars) measurements was analyzed by electrophoresis on 0.8% agarose gel. Sample ID is indicated at the bottom. Lane L contains 200 ng of DNA as the reference for normalization. Densitometric analysis (bar chart) was performed by ImageJ software . It is clear from the electrophoretic bands and their densitometric charts that NanoDrop overestimates DNA concentration.
Figure 3
Figure 3. Cross-validation of DNA samples quantification by qPCR.
Bland-Altman plots for inter-technology (NanoDrop or Qubit vs. qPCR) comparison of all samples (A), and according to the different sample sources, as indicated (B, C). A) Qubit measurements show high correlation (mean measured/expected ratio  = 0.92; SD  = 0.69; Wilcoxon signed rank test p = 0.07) with the measurements obtained by qPCR (x-axis), whereas NanoDrop measurements tend to overestimate samples concentration (mean measured/expected ratio  = 3.8; SD  = 6.4; Wilcoxon signed rank test p<0.0001). B) Fresh frozen sample quantification by NanoDrop overestimates (mean measured/expected ratio  = 1.48; SD  = 0.57; Wilcoxon signed rank test p<0.01) the DNA concentration detected by quantitative PCR, while Qubit underestimates (mean measured/expected ratio  = 0.78; SD  = 0.32; Wilcoxon signed rank test p<0.001) the value. C) In formalin-fixed paraffin-embedded samples a better concentration estimation is obtained by Qubit (mean measured/expected ratio  = 1.23; SD  = 1.15; Wilcoxon signed rank test p = 0.91) than by NanoDrop (mean measured/expected ratio  = 9.21; SD  = 9.95; Wilcoxon signed rank test p<0.004).
Figure 4
Figure 4. Influence of RNA contamination on DNA quantification.
DNA quantifications (n = 5) by NanoDrop and Qubit in the presence of RNA contamination. A DNA sample with a concentration of 38 ng/µl was mixed with different volumes of total RNA at 33 ng/µl extracted from the same tissue sample to obtain the indicated ratios; bars and brackets indicate mean and 95% confidence interval; asterisks show measurements significantly different from pure DNA (* p<0.05; ** p<0.001; Dunnett's post-hoc test). NanoDrop measurements were heavily influenced by the presence of RNA contamination (ANOVA p<0.0001), whereas Qubit values were less affected (ANOVA p<0.01). Black bars  =  NanoDrop; gray bars  =  Qubit.
Figure 5
Figure 5. DNA qualification for next-generation sequencing applications.
Effect of low-quality DNA on next-generation sequencing (NGS) workflow. Three FFPE samples were tested for construction of NGS amplicon libraries (Ion Torrent Ampliseq Cancer Panel). Qubit: 40 ng of DNA according to Qubit measurement were processed using the Ampliseq library construction kit (multiplex PCR amplification of 191 DNA regions from 46 cancer-related genes). NanoDrop: absorption spectra of samples showed different degrees of organic contamination (230 nm spike, A260/A230 ratio). Agilent: quality and quantity of the obtained libraries were evaluated by Agilent high sensitivity assay on-chip electrophoresis, where the library is represented by the large band between 150 and 200 bp. Fragments test: histogram showing length and abundance of produced sequences. Sample FFPE 5 did not produce a good library due to high organic contamination; this is revealed by the remarkable spike at 230 nm that concurs to the low 260/230 ratio, and explains the faint electrophoretic band and the almost flat fragments test histogram.

Similar articles

Cited by

References

    1. Dong H, Wang S (2012) Exploring the cancer genome in the era of next-generation sequencing. Front Med 6: 48–55. - PubMed
    1. Brosnan JA, Iacobuzio-Donahue CA (2012) A new branch on the tree: next-generation sequencing in the study of cancer evolution. Semin Cell Dev Biol 23: 237–242. - PMC - PubMed
    1. Ma QC, Ennis CA, Aparicio S (2012) Opening Pandora's Box – the new biology of driver mutations and clonal evolution in cancer as revealed by next generation sequencing. Curr Opin Genet Dev 22: 3–9. - PubMed
    1. Meyerson M, Gabriel S, Getz G (2010) Advances in understanding cancer genomes through second-generation sequencing. Nat Rev Genet 11: 685–696. - PubMed
    1. Haque KA, Pfeiffer RM, Beerman MB, Struewing JP, Chanock SJ, et al. (2003) Performance of high-throughput DNA quantification methods. BMC Biotechnol 3: 20. - PMC - PubMed

Publication types