. 2013 Jun 6;8(6):e64760.
doi: 10.1371/journal.pone.0064760. Print 2013.

N-way FRET microscopy of multiple protein-protein interactions in live cells

Affiliations

N-way FRET microscopy of multiple protein-protein interactions in live cells

Adam D Hoppe et al. PLoS One. .

Abstract

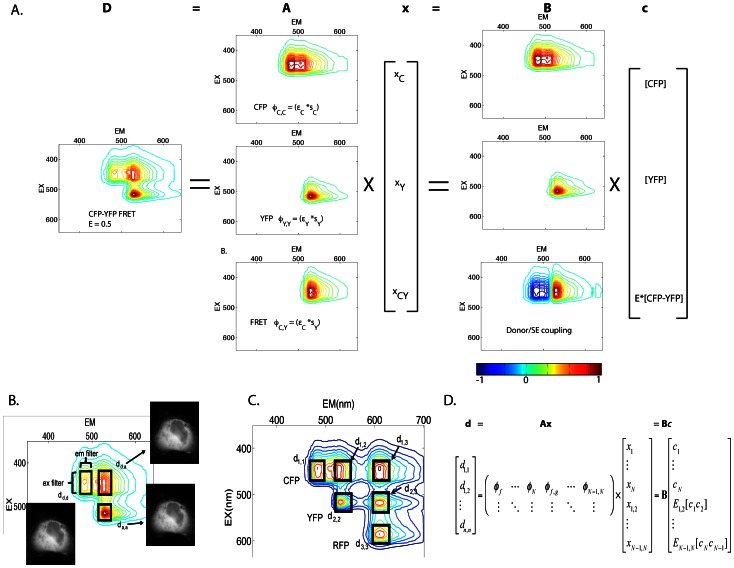
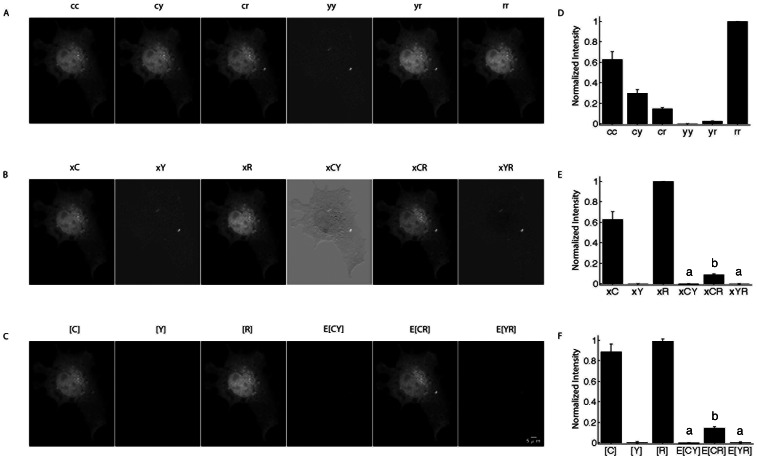
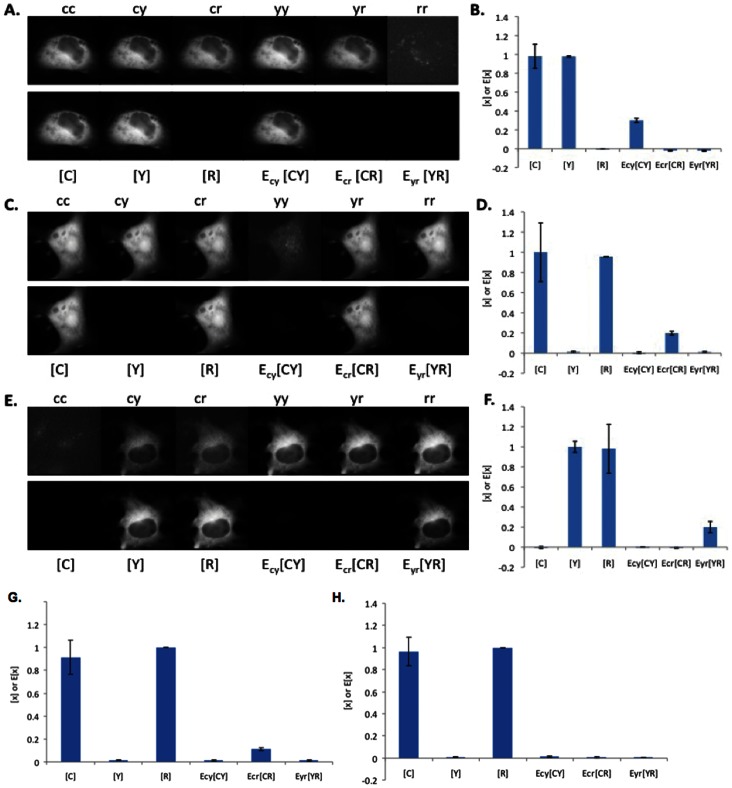
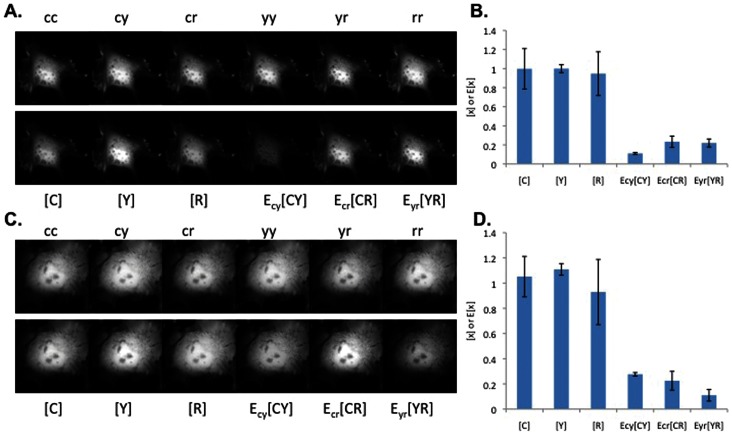
Fluorescence Resonance Energy Transfer (FRET) microscopy has emerged as a powerful tool to visualize nanoscale protein-protein interactions while capturing their microscale organization and millisecond dynamics. Recently, FRET microscopy was extended to imaging of multiple donor-acceptor pairs, thereby enabling visualization of multiple biochemical events within a single living cell. These methods require numerous equations that must be defined on a case-by-case basis. Here, we present a universal multispectral microscopy method (N-Way FRET) to enable quantitative imaging for any number of interacting and non-interacting FRET pairs. This approach redefines linear unmixing to incorporate the excitation and emission couplings created by FRET, which cannot be accounted for in conventional linear unmixing. Experiments on a three-fluorophore system using blue, yellow and red fluorescent proteins validate the method in living cells. In addition, we propose a simple linear algebra scheme for error propagation from input data to estimate the uncertainty in the computed FRET images. We demonstrate the strength of this approach by monitoring the oligomerization of three FP-tagged HIV Gag proteins whose tight association in the viral capsid is readily observed. Replacement of one FP-Gag molecule with a lipid raft-targeted FP allowed direct observation of Gag oligomerization with no association between FP-Gag and raft-targeted FP. The N-Way FRET method provides a new toolbox for capturing multiple molecular processes with high spatial and temporal resolution in living cells.


Conflict of interest statement

Competing Interests: The authors have declared that no competing interests exist.

Figures

Figure 1
Figure 1. N-Way FRET on the excitation-emission landscape.
Spectroscopically, FRET is a coupling between donor excitation and acceptor emission. This excitation-emission coupling (Φ) can be described by the outer product of the excitation vector ε and an emission vector s. The Φ signatures define the spectral library A for the N-Way FRET linear unmixing problem (d = Ax = Bc) that can be viewed on the 2D excitation-emission landscape in addition to viewing the data (d). Specifically, these appear as topographical features with light green = 0, warmer colors are increasing height and dark blue colors are negative. A) The 2D spectrum for CFP-YFP FRET can be decomposed into the superposition of CFP (ΦC,C), YFP (ΦY,Y) and CFP-YFP FRET (ΦC,Y). Recovering ε and s for each fluorophore in the system allows calculation of the unmixing matrix, A which can be linearly unmixed to estimate the fluorescence from CFP (xCFP), YFP (xYFP) and the FRET sensitized emission (xCY). B can be obtained by calibration with known FRET efficiency standards. Linear unmixing with B to allows estimation of concentrations of total fluorophores ([CFP] and [YFP]) and apparent FRET (ECY[CFP-YFP]) which are contained in vector c. During this step, a negative component (blue color) couples the FRET-associated decrease in donor fluorescence to an increase in acceptor fluorescence. B) For most instruments, the complete landscape is not measured, rather, excitation and emission bandpass filters (boxes) define portions of the excitation-emission landscape. For 2-Way FRET the three images needed are dc,c, dy,y and dc,y. C) As more fluorophores are added to the system (e.g. the addition of RFP), the spectral landscape grows by the addition of direct fluorescence components along the diagonal (d1,1, d2,2, and d3,3) and their possible FRET interactions which appear as off-diagonal peaks (e.g. d1,2, d1,3 and d2,3). D) The mathematical form of this problem generalizes to account for multiple fluorophores engaged in FRET.
Figure 2
Figure 2. Linear unmixing of FRET amplitudes and N-Way FRET analysis in living cells.
A) Images of live COS7 cells expressing a CFP-RFP linked construct were captured using paired excitation and emission filter combinations (e.g. cc = CFP excitation, CFP emission) to sample the N-Way FRET landscape. D) ROIs to provide the raw intensities from these cells. Unmixing of these images using matrix A recovers the fluorescence abundances (e.g. xC) and showed that FRET could be observed only between CFP and RFP (e.g. xCR) (B, images are scaled independently) and was reproducible over multiple cells (E). C) Quantitative unmixing with N-Way FRET showed that equal abundances of CFP and RFP were present and FRET was observed as E[CR], but no was observed for E[CY] or E[YR] as expected (F). 20 cells per condition; data from Scope 2; bars not connected by the same letter are significantly different (p<0.05) by Tukey HSD post hoc comparison of means; error bars are standard deviation.
Figure 3
Figure 3. N-Way FRET recovers concentrations and apparent FRET efficiencies from cells expressing FP-FP fusions.
Cells were transfected with CFP-YFP (A and B), RFP-CFP (C and D), RFP-YFP (E and F), RFP-darkFP-CFP (G) and RFP-kinesin-CFP (H). The raw images (top rows, independently scaled) were analyzed by N-Way FRET, using B−1, to produce the concentration estimates (bottom rows) ([FP], display scale, 0–1,400 intensity units) and the apparent FRET efficiencies (EFP-FP[FP-FP], display scale 0–500 intensity units). Images are representative of 20 cells per condition. Plots of concentration estimates (C, D, F, G and H) indicated that N-Way FRET accurately recovered the correct one-to-one stoichiometry of each FP in the sample as well as their apparent efficiencies (n = 20 for each). Note the decreasing FRET efficiency observed for increasing size of inserted peptide or proteins: high FRET (RFP-CFP, D), low FRET (darkFP, G) or no FRET (kinesin, H) seen in ECR[CR]. Data from Scope 1.
Figure 4
Figure 4. N-Way FRET recovers the relative concentrations and apparent FRET efficiencies from cells expressing FP-FP-FP fusions.
Cells were transfected with CFP-RFP-YFP (A and B) and YFP-CFP-RFP (C and D) linked constructs. Spectral FRET data (top row) were unmixed by N-Way FRET to produce the concentration estimates (bottom rows) of the total FP (bound and free, [FP]) and the apparent complex concentrations (EFP-FP[FP-FP]). Plots of concentration estimates (C and D) averaged over 20 cells indicate that N-Way FRET recovered correct one-to-one stoichiometry of all three FPs in the sample and that the FPs on the ends of the polypeptide gave the lowest FRET efficiencies (error bars are standard deviation, 20 cells for each, from Scope 2).
Figure 5
Figure 5. N-Way FRET measures HIV-Gag oligomerization but no association with lipid rafts in a single cell.
A) COS7 cells transfected with CFP-Gag, YFP-Gag and Cherry-Gag and imaged by N-Way FRET display strong FRET signals on small punctate structures (display ranges: [FP] = 0–30, E[FP FP] = 0–3 intensity units). B) Quantification of these signals confirmed that Gag oligomerization resulted in close apposition of the three fluorophores that permitted detection of FRET (n = 8 cells). C) Cells transfected with YFP-Gag, Cherry-Gag and the lipid raft marker CFP-Fyn(10) only showed FRET between YFP-Gag and Cherry-Gag (display ranges: [C] = 0–150, [Y] & [R] = 0–20, E[FP FP] = 0–6). D) Quantification of N-Way FRET results from C) indicate minimal FRET with CFP-Fyn, but high FRET for Cherry-Gag and YFP-Gag (n = 3 cells, Scope 2, bars not connected by the same letter are significantly different (p<0.05) by Tukey HSD post hoc comparison of means; error bars are standard deviation).
Figure 6
Figure 6. N-Way FRET error propagation for YFP-CFP-RFP linked construct.
A) The coefficient of variation (CV) was computed from the raw images of a cell expressing the YFP-CFP-RFP linked construct using the photon conversion factor for the CCD cameras. B) Unmixed measurement of the total fluorophores and apparent complex concentrations were estimated, along with their error-propagated CV. As expected, the weakest FRET signals showed the greatest CV (warm colors on the periphery of the cell). C) Stoichiometric FRET ratios for the CFP-YFP FRET (CR and YR shown in Fig. S4) demonstrated uniform apparent FRET efficiencies (EA and ED) and molar ratios (R). The CV (bottom row) indicates that the error was greatest in the periphery of the cell in the EA image. D) Quantification of the concentrations from 10 cells. Error bars are standard deviation; data from Scope 2, bars not connected by the same letter are significantly different (p<0.05) by Tukey HSD post hoc comparison of means.

Similar articles

Cited by

References

    1. Hoppe AD, Swanson JA (2004) Cdc42, Rac1, and Rac2 display distinct patterns of activation during phagocytosis. Mol Biol Cell 15: 3509–3519. - PMC - PubMed
    1. Sorkin A, McClure M, Huang F, Carter R (2000) Interaction of EGF receptor and grb2 in living cells visualized by fluorescence resonance energy transfer (FRET) microscopy. Curr Biol 10: 1395–1398. - PubMed
    1. Beemiller P, Hoppe AD, Swanson JA (2006) A phosphatidylinositol-3-kinase-dependent signal transition regulates ARF1 and ARF6 during Fcgamma receptor-mediated phagocytosis. PLoS Biol 4: e162. - PMC - PubMed
    1. Yoshizaki H, Ohba Y, Kurokawa K, Itoh RE, Nakamura T, et al. (2003) Activity of Rho-family GTPases during cell division as visualized with FRET-based probes. J Cell Biol 162: 223–232. - PMC - PubMed
    1. Lu A, Tebar F, Alvarez-Moya B, Lopez-Alcala C, Calvo M, et al. (2009) A clathrin-dependent pathway leads to KRas signaling on late endosomes en route to lysosomes. J Cell Biol 184: 863–879. - PMC - PubMed

Publication types

MeSH terms

Substances

LinkOut - more resources