High quality topic extraction from business news explains abnormal financial market volatility
- PMID: 23762258
- PMCID: PMC3675119
- DOI: 10.1371/journal.pone.0064846
High quality topic extraction from business news explains abnormal financial market volatility
Abstract
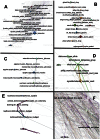
Understanding the mutual relationships between information flows and social activity in society today is one of the cornerstones of the social sciences. In financial economics, the key issue in this regard is understanding and quantifying how news of all possible types (geopolitical, environmental, social, financial, economic, etc.) affects trading and the pricing of firms in organized stock markets. In this article, we seek to address this issue by performing an analysis of more than 24 million news records provided by Thompson Reuters and of their relationship with trading activity for 206 major stocks in the S&P US stock index. We show that the whole landscape of news that affects stock price movements can be automatically summarized via simple regularized regressions between trading activity and news information pieces decomposed, with the help of simple topic modeling techniques, into their "thematic" features. Using these methods, we are able to estimate and quantify the impacts of news on trading. We introduce network-based visualization techniques to represent the whole landscape of news information associated with a basket of stocks. The examination of the words that are representative of the topic distributions confirms that our method is able to extract the significant pieces of information influencing the stock market. Our results show that one of the most puzzling stylized facts in financial economies, namely that at certain times trading volumes appear to be "abnormally large," can be partially explained by the flow of news. In this sense, our results prove that there is no "excess trading," when restricting to times when news is genuinely novel and provides relevant financial information.
Conflict of interest statement
Figures


Similar articles
-
Cross-correlation asymmetries and causal relationships between stock and market risk.PLoS One. 2014 Aug 27;9(8):e105874. doi: 10.1371/journal.pone.0105874. eCollection 2014. PLoS One. 2014. PMID: 25162697 Free PMC article.
-
Financial volatility trading using a self-organising neural-fuzzy semantic network and option straddle-based approach.Expert Syst Appl. 2011 May;38(5):4668-4688. doi: 10.1016/j.eswa.2010.07.116. Epub 2010 Aug 20. Expert Syst Appl. 2011. PMID: 32288336 Free PMC article.
-
Statistical properties and pre-hit dynamics of price limit hits in the Chinese stock markets.PLoS One. 2015 Apr 13;10(4):e0120312. doi: 10.1371/journal.pone.0120312. eCollection 2015. PLoS One. 2015. PMID: 25874716 Free PMC article.
-
Investment strategies used as spectroscopy of financial markets reveal new stylized facts.PLoS One. 2011;6(9):e24391. doi: 10.1371/journal.pone.0024391. Epub 2011 Sep 14. PLoS One. 2011. PMID: 21935403 Free PMC article.
-
Speculative behavior and asset price dynamics.Nonlinear Dynamics Psychol Life Sci. 2003 Jul;7(3):245-62. doi: 10.1023/a:1022867217510. Nonlinear Dynamics Psychol Life Sci. 2003. PMID: 12876435 Review.
Cited by
-
On the impact of publicly available news and information transfer to financial markets.R Soc Open Sci. 2021 Jul 28;8(7):202321. doi: 10.1098/rsos.202321. eCollection 2021 Jul. R Soc Open Sci. 2021. PMID: 34350010 Free PMC article.
-
Understanding heterogeneity of investor sentiment on social media: A structural topic modeling approach.Front Artif Intell. 2022 Oct 6;5:884699. doi: 10.3389/frai.2022.884699. eCollection 2022. Front Artif Intell. 2022. PMID: 36277168 Free PMC article.
-
Predicting standardized absolute returns using rolling-sample textual modelling.PLoS One. 2021 Dec 7;16(12):e0260132. doi: 10.1371/journal.pone.0260132. eCollection 2021. PLoS One. 2021. PMID: 34874945 Free PMC article.
-
Measuring the diffusion of innovations with paragraph vector topic models.PLoS One. 2020 Jan 22;15(1):e0226685. doi: 10.1371/journal.pone.0226685. eCollection 2020. PLoS One. 2020. PMID: 31967999 Free PMC article.
-
Assessing systemic risk in financial markets using dynamic topic networks.Sci Rep. 2022 Feb 17;12(1):2668. doi: 10.1038/s41598-022-06399-x. Sci Rep. 2022. PMID: 35177679 Free PMC article.
References
-
- Cutler D, Poterba J, Summers L (1989) What moves stock prices? Journal of Portfolio Management 15: 4–12.
-
- McQueen G, Roley VV (1993) Stock prices, news, and business conditions. Review of Fin Studies 6(3): 683–707.
-
- Fleming MJ, Remolona EM (1997)What moves the bond market. Journal of Portfolio Management : 28–38.
-
- Fair R (2002) Events that shook the market. Journal of Business 75(4): 713–731.
-
- Joulin A, Lefevre A, Grunberg D, Bouchaud JP (2008) Stock price jumps: news and volume play a minor role. Wilmott Magazine Sep/Oct: 46.
Publication types
MeSH terms
LinkOut - more resources
Full Text Sources
Other Literature Sources

