. 2013 Jun 10;8(6):e64880.
doi: 10.1371/journal.pone.0064880. Print 2013.

The elongation complex components BRD4 and MLLT3/AF9 are transcriptional coactivators of nuclear retinoid receptors

Affiliations

The elongation complex components BRD4 and MLLT3/AF9 are transcriptional coactivators of nuclear retinoid receptors

Sébastien Flajollet et al. PLoS One. .

Abstract

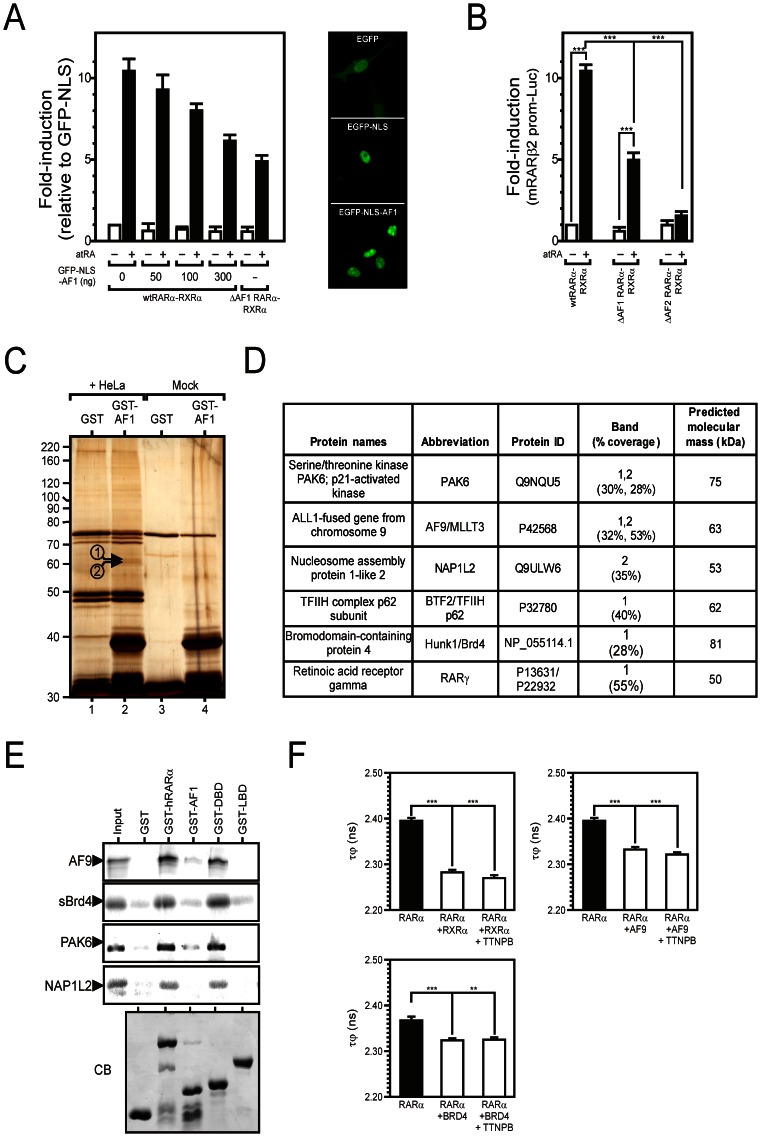
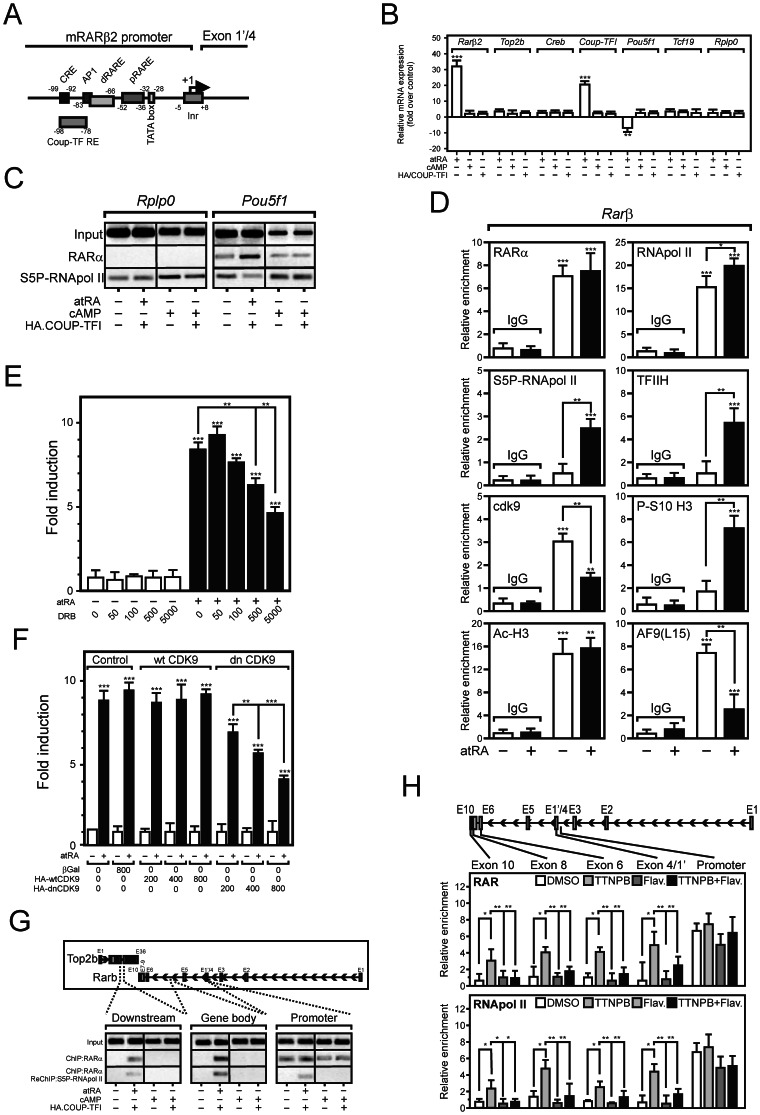
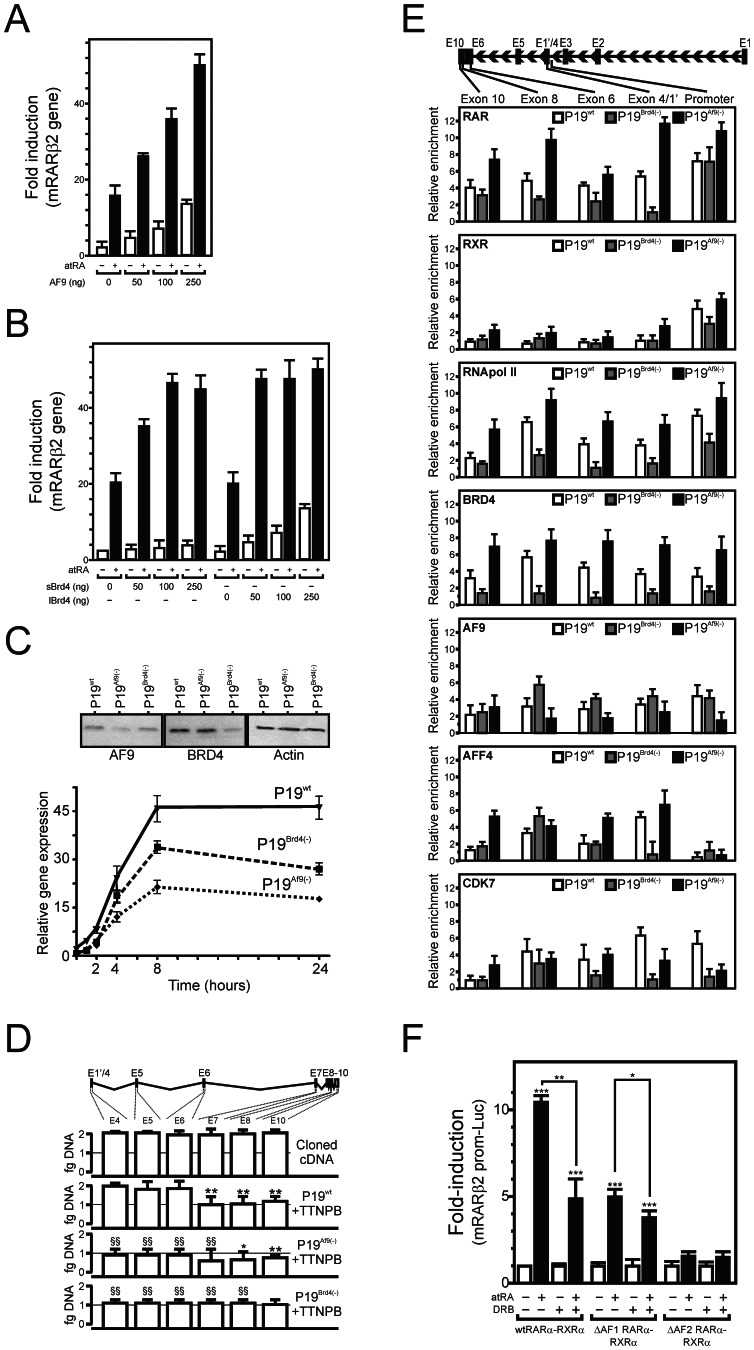
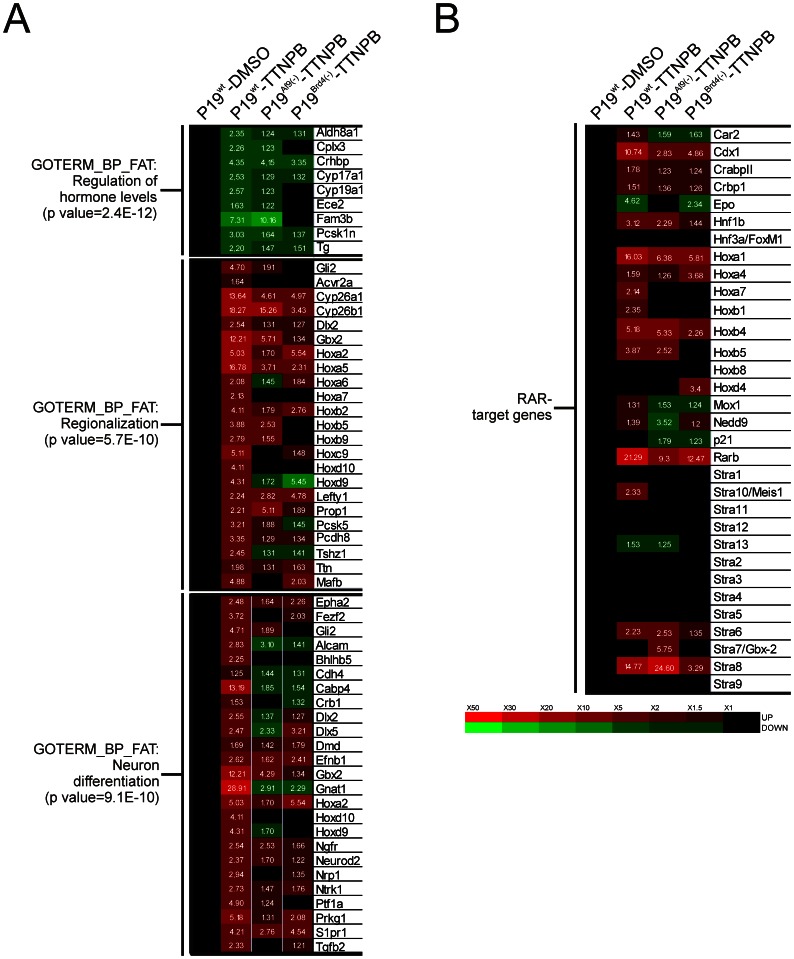
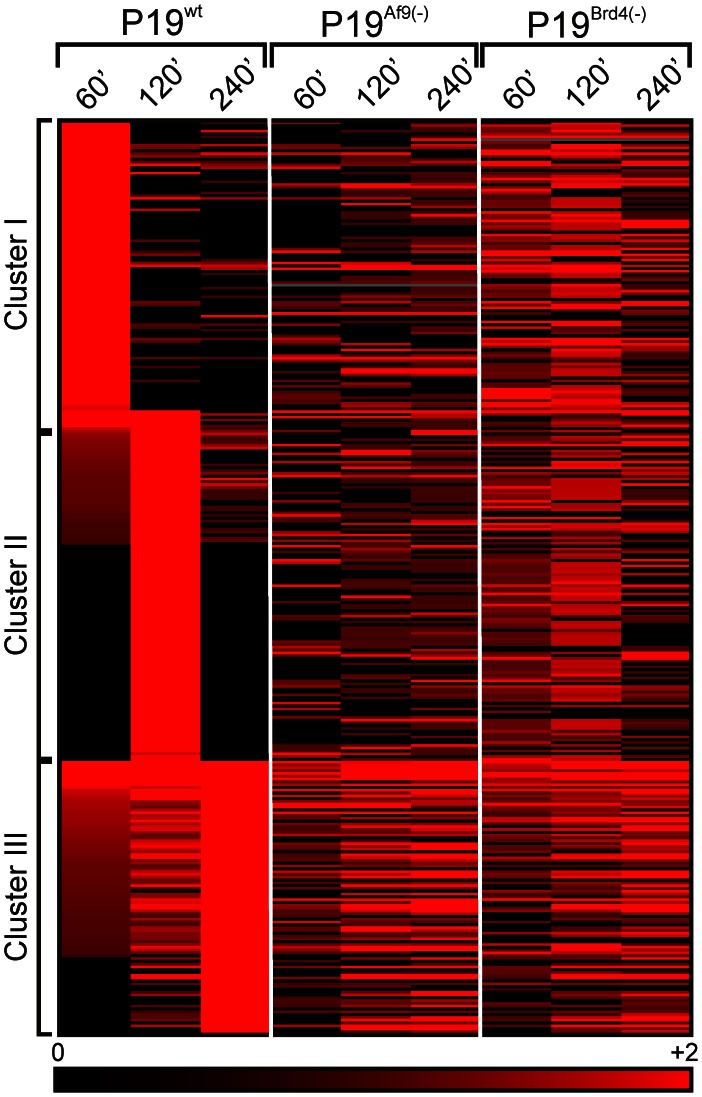
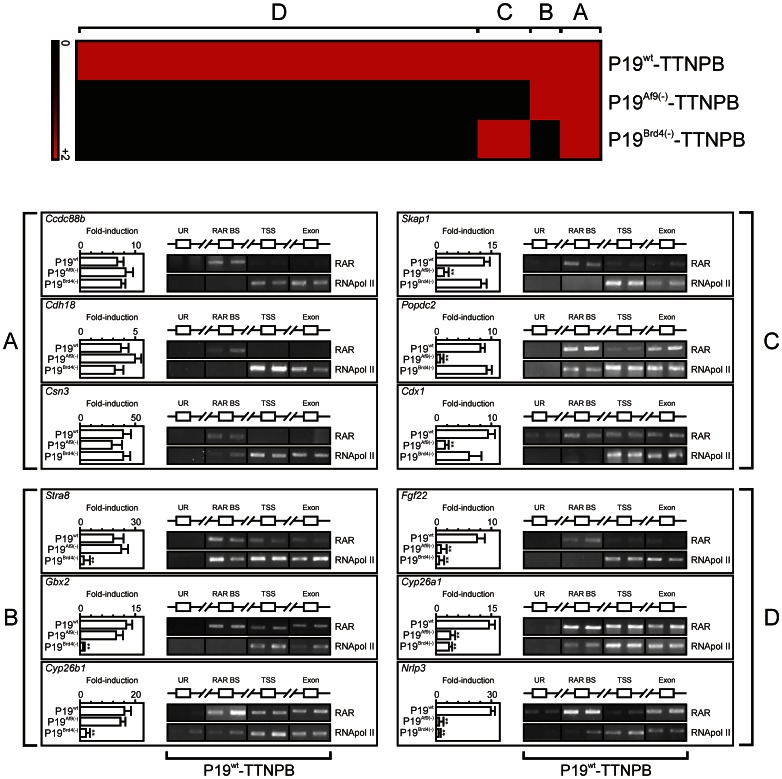
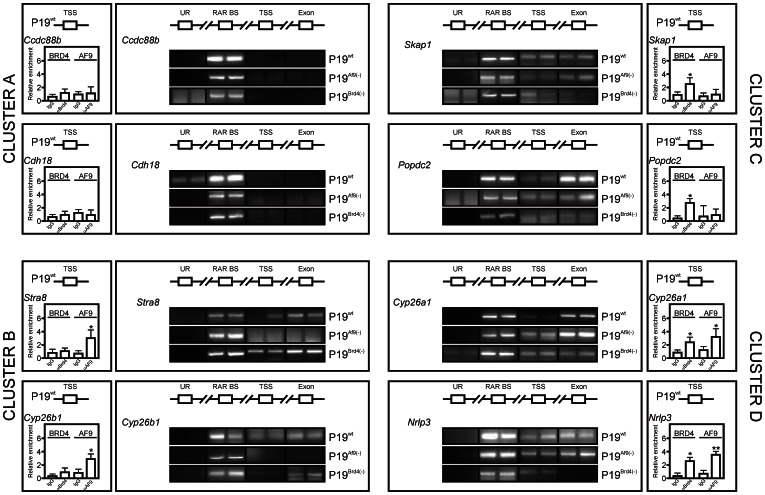
Nuclear all-trans retinoic acid receptors (RARs) initiate early transcriptional events which engage pluripotent cells to differentiate into specific lineages. RAR-controlled transactivation depends mostly on agonist-induced structural transitions in RAR C-terminus (AF-2), thus bridging coactivators or corepressors to chromatin, hence controlling preinitiation complex assembly. However, the contribution of other domains of RAR to its overall transcriptional activity remains poorly defined. A proteomic characterization of nuclear proteins interacting with RAR regions distinct from the AF-2 revealed unsuspected functional properties of the RAR N-terminus. Indeed, mass spectrometry fingerprinting identified the Bromodomain-containing protein 4 (BRD4) and ALL1-fused gene from chromosome 9 (AF9/MLLT3), known to associate with and regulates the activity of Positive Transcription Elongation Factor b (P-TEFb), as novel RAR coactivators. In addition to promoter sequences, RAR binds to genomic, transcribed regions of retinoid-regulated genes, in association with RNA polymerase II and as a function of P-TEFb activity. Knockdown of either AF9 or BRD4 expression affected differentially the neural differentiation of stem cell-like P19 cells. Clusters of retinoid-regulated genes were selectively dependent on BRD4 and/or AF9 expression, which correlated with RAR association to transcribed regions. Thus RAR establishes physical and functional links with components of the elongation complex, enabling the rapid retinoid-induced induction of genes required for neuronal differentiation. Our data thereby extends the previously known RAR interactome from classical transcriptional modulators to components of the elongation machinery, and unravel a functional role of RAR in transcriptional elongation.


Conflict of interest statement

Competing Interests: The authors have declared that no competing interests exist.

Figures

Figure 1
Figure 1. The N-terminus of RARα interacts with nuclear proteins.
(A) A nucleus-targeted RARα AF-1 domain acts as a dominant negative receptor. HeLa cells were cotransfected with expression vectors coding for wild type (wt) RXRα, wtRARα, GFP-NLS and GFP-NLS-AF-1 at the indicated ratio together with a mRarβ2 promoter-driven reporter gene (mRARβ2-Luc). Cells were treated overnight with 1 µM atRA and luciferase activity was quantified. Basal expression levels were arbitrarily set to 1 and data are expressed as the mean±SEM (n = 3). *, p<0.05; **, p<0.01; ***, p<0.005. (Right panel) Confocal laser microscopy of transfected HeLa cells. (B) The RARα AF-1 domain is transcriptionally active. HeLa cells were transfected with mRARβ2-Luc and expression vectors coding for wtRXRα, wtRARα, N–terminally ΔAF-1-RARα) or C-terminally truncated ΔAF-2-RARα) RARα. Cell treatment, luciferase assays and calculations are as in (A). (C, D) Isolation and identification of proteins interacting with the AF-1 transactivation motif of RARα. AF-1 fused to GST (GST-AF-1) or GST alone (GST) were immobilized on a matrix and incubated with HeLa nuclear extracts (+HeLa) or buffer alone (Mock). Numbers indicate bands that were subjected to mass spectrometry analysis. (D) The table indicates the name, protein abbreviation, the UniProtKB/TrEMBL entry, percentage of peptide coverage in two representative purifications, and the predicted molecular mass. (E) Target validation by GST pulldown assays. Various domains of RARα were expressed as fusion proteins to GST (left panel) and used as baits for 35S-labeled shortBRD4 (sBRD4), AF9, PAK6 and NAP1L2. CB: Coomassie Blue staining of RAR derivatives adsorbed on glutathione-Sepharose. (F) Interaction of RARα with BRD4 or AF9. FLIM-based FRET fluorescence assays were performed to determine the lifetime of the donor (GFP) in the indicated conditions.
Figure 2
Figure 2. RAR localizes to transcribed regions of the Rarβ2 gene in a P-TEFB-dependent manner.
(A) Structure of the mouse Rarβ2 promoter. pRARE: proximal RARE; dRARE: distal RARE. (B) Gene expression in P19 cells. P19 cells were treated for 48 hours with DMSO, 1 µM all trans RA (atRA), 250 µM cAMP or transfected with a HA-tag COUP-TFI expression vector. Expression of Rarβ2, Top2β, Creb, Coup-TFI, Tcf19 and Rplp0 were quantified by RT-QPCR. Basal expression levels were arbitrarily set to 1 and data are expressed as the mean±SEM (n = 3). *, p<0.05; **, p<0.01; ***, p<0.005. (C) RARα and phosphorylated RNApol II loading at the Rplp0 and Pou5f1/Oct4 promoters. P19 cells were treated as in (B) and ChIP assays were performed with indicated antibodies. (D) AF9 colocalizes to the Rarβ2 promoter. P19 cells were treated for 4 hours with 1 µM atRA, and ChIP assays were carried out as described. The specific enrichment in Rarβ2 promoter sequence is expressed after normalization to background values (Myoglobin gene). Data are expressed as the mean±SEM (n = 2). *, p<0.05; **, p<0.01; ***, p<0.005. (E) DRB inhibition of the Rarβ2 gene transcription. P19 cells were treated with the indicated combination of atRA (1 µM) and varying doses of DRB (50 to 5000 nM) for 4 hours. Rarβ2 mRNA was quantified by RT-QPCR. (F) A CDK9 dominant negative mutant inhibits Rarβ2 gene expression. P19 were cotransfected with increasing amount of pCMV-lacZ (control), pCMV-HA-wtCDK9, or pCMV-HA-dnCDK9 expression vectors at the indicated ratio, then treated 24 hours with 1 µM atRA. Gene expression was quantified as above and data expressed as the mean±SEM (n = 4). *, p<0.05; **, p<0.01; ***, p<0.005. (G) RAR and phosphorylated RNApol II are detected at transcribed regions of the Rarβ2 gene. P19 cells were treated as in (D) and ChIP/reChIP assays were performed. (H) P-TEFb inhibition prevents RAR association to Rarβ2 elongated regions. P19 cells were treated for 4 hours with the indicated combination of TTNPB (1 µM) or flavopiridol (250 nM). ChIP assays (n = 2) were performed as in (D).
Figure 3
Figure 3. AF9 and BRD4 coactivate RARα in a ligand-independent manner.
(A, B) P19 cells were transfected with the indicated amounts of AF9, sBRD4 or lBRD4 expression vectors for 24 hours with or without 1 µM atRA and Rarβ2 gene expression was assayed by RT-QPCR. The basal expression level in non transfected, untreated cells was arbitrarily set to 1 and data were expressed as the mean±SEM (n = 5). *, p<0.05; **, p<0.01; ***, p<0.005. (C) Af9 or Brd4 knockdowns. (C, upper panel) AF9 or BRD4 expression was assayed by western blot analysis in P19wt, P19Af9(−) and P19Brd4(−). (C, lower panel) Rarβ2 gene expression in AF9- or BRD4-depleted P19 cells. The time-dependent expression of Rarβ2 upon stimulation with 1 µM TTNPB was quantified by RT-QPCR. (D) Exon-specific RT-QPCR assay of the Rarβ2 mRNA. Cloned mRarβ2 cDNA was used as a standard in PCR reaction, and used to select PCR primer sets displaying a similar efficiency (“Cloned cDNA”). Rarβ2 mRNA from either P19wt, P19Af9(−) or P19Brd4(−) was then formally quantified by Q-PCR. **, p<0.01, intra-sample comparison; §§, p<0.01, inter-sample comparison. (E) RAR associates to Rarβ2 transcribed regions as a function of AF9 and BRD4 levels. P19wt, P19Af9(−) or P19Brd4(−) were treated with 1 µM TTNPB for 1 hour and ChIP assays were performed. The specific enrichment in the different Rarβ2 amplicons was assayed by Q-PCR and expressed normalized to background values (myoglobin gene). Data are expressed as the mean±SEM (n = 2). *, p<0.05; **, p<0.01; ***, p<0.005. (F) The AF-1 region of RAR confers DRB sensitivity to RA-induced transcription of the Rarβ2 promoter. P19 cells were cotransfected as indicated with expression vectors coding for wtRXRα, wtRARα or ΔAF-1-RARα or ΔAF-2-RARα together with the mRARβ2-Luc reporter gene. Cells were treated 24 hours with 1 µM atRA and/or DRB and luciferase activity was quantified. Basal expression levels were arbitrarily set to 1 and data are expressed as the mean±SEM (n = 6). *, p<0.05; **, p<0.01; ***, p<0.005.
Figure 4
Figure 4. Gene expression level in response to RARα activation in wild type, AF9- and BRD4-deficient backgrounds.
(A) Genes exhibiting a fold-change above 1.2 fold in TTNPB-treated P19wt cells were clusterized according to a functional gene ontology classification. Representative functional clusters from the top 10 hits are shown. The basal level in non treated P19wt was arbitrarily set to 1 and is depicted by black boxes. Numbers indicate the fold change ratio of individual genes relative to untreated wt P19 (red: upregulation; green: downregulation; black, no change). (B) Gene expression levels of known atRA-target genes. RA-target genes were selected from the literature and their expression levels were extracted from microarray data. Results are represented as in (A).
Figure 5
Figure 5. Time-dependent induction of gene expression upon RARα activation in P19wt, P19Af9 (−) or P19Brd4 (−).
Cells were treated with TTNPB for indicated times and gene expression patterns were monitored. Genes induced more than 2-fold and peaking at either 60 minutes, 120 minutes or 240 minutes in the P19wt background were clusterized to define cluster I (peaking at 60 minutes), cluster II (peaking at 120 minutes) and cluster III (peaking at 240 minutes). Associated gene lists were used to generate entity lists in Genespring to follow the expression of these genes in the P19Af9(−) or P19Brd4(−) background. Expression at different times in distinct cellular backgrounds is displayed as a heatmap.
Figure 6
Figure 6. RARα association to transcribed regions in AF9-or BRD4-independent genes.
The response of TTNPB-inducible genes (FC>2 after 4 hours) in P19wt was compared to that in P19Af9(−) or P19Brd4(−) in similar conditions. Genes losing their responsiveness to TTNPB (FC<1.2) in either the P19Brd4(−) background (cluster B), the P19Af9(−)background (cluster C) or both (cluster D) were identified by microarray data analysis. Genes maintaining an inducibility similar to that observed in P19wt in either the P19Af9(−) or the P19Brd4(−) background were grouped in Cluster A. Genes in each cluster were searched for the occurrence of RAR binding sites on the basis of RAR ChIP-Seq data carried out in mouse ES cells . Three representative genes were selected from each cluster and their inducibility was validated by RT-QPCR in each condition (n = 3, left inset). RARα and RNApol II association to an upstream region (UR), RAR binding site (RAR BS), transcriptional start site region (TSS) and an exon (Exon) was assessed in independent, duplicate ChIP-PCR assays after a 4-hour challenge of P19wt with TTNPB. Input lanes showed an equal loading but were omitted for space purposes.
Figure 7
Figure 7. AF9 or BRD4 are required for RAR interaction with exonic regions.
Two representative genes from clusters defined in Figure 5 were selected. The loading of AF9 and BRD4 to the TSS was assayed by ChIP-QPCR (n = 2) and results normalized to background values (Myoglobin gene) are represented in left insets (bar graphs). The association of RAR to an upstream region (UR), RAR binding site (RAR BS), transcriptional start site region (TSS) and an exon (Exon) was assessed in independent, duplicate ChIP-PCR assays after a 4-hour challenge of P19wt, P19Brd4(−) or P19Af9(−) cells with TTNPB. Data are expressed as the mean±SEM (n = 2). *, p<0.05; **, p<0.01.

Similar articles

Cited by

References

    1. Samarut E, Rochette-Egly C (2012) Nuclear retinoic acid receptors: conductors of the retinoic acid symphony during development. Mol Cell Endocrinol 348: 348–360. - PubMed
    1. Ju BG, Lunyak VV, Perissi V, Garcia-Bassets I, Rose DW, et al. (2006) A topoisomerase IIbeta-mediated dsDNA break required for regulated transcription. Science 312: 1798–1802. - PubMed
    1. Pavri R, Lewis B, Kim TK, Dilworth FJ, Erdjument-Bromage H, et al. (2005) PARP-1 determines specificity in a retinoid signaling pathway via direct modulation of mediator. Mol Cell 18: 83–96. - PubMed
    1. Martin PJ, Lardeux V, Lefebvre P (2005) The proliferating cell nuclear antigen regulates retinoic acid receptor transcriptional activity through direct protein-protein interaction. Nucl Acids Res 33: 4311–4321. - PMC - PubMed
    1. Lefebvre B, Brand C, Flajollet S, Lefebvre P (2006) Down-Regulation of the Tumor Suppressor Gene Retinoic Acid Receptor {beta}2 through the Phosphoinositide 3-Kinase/Akt Signaling Pathway. Mol Endocrinol 20: 2109–2121. - PubMed

Publication types

MeSH terms