. 2013 Jun 6;8(6):e65671.
doi: 10.1371/journal.pone.0065671. Print 2013.

MiR-7 triggers cell cycle arrest at the G1/S transition by targeting multiple genes including Skp2 and Psme3

Affiliations

MiR-7 triggers cell cycle arrest at the G1/S transition by targeting multiple genes including Skp2 and Psme3

Noelia Sanchez et al. PLoS One. .

Abstract

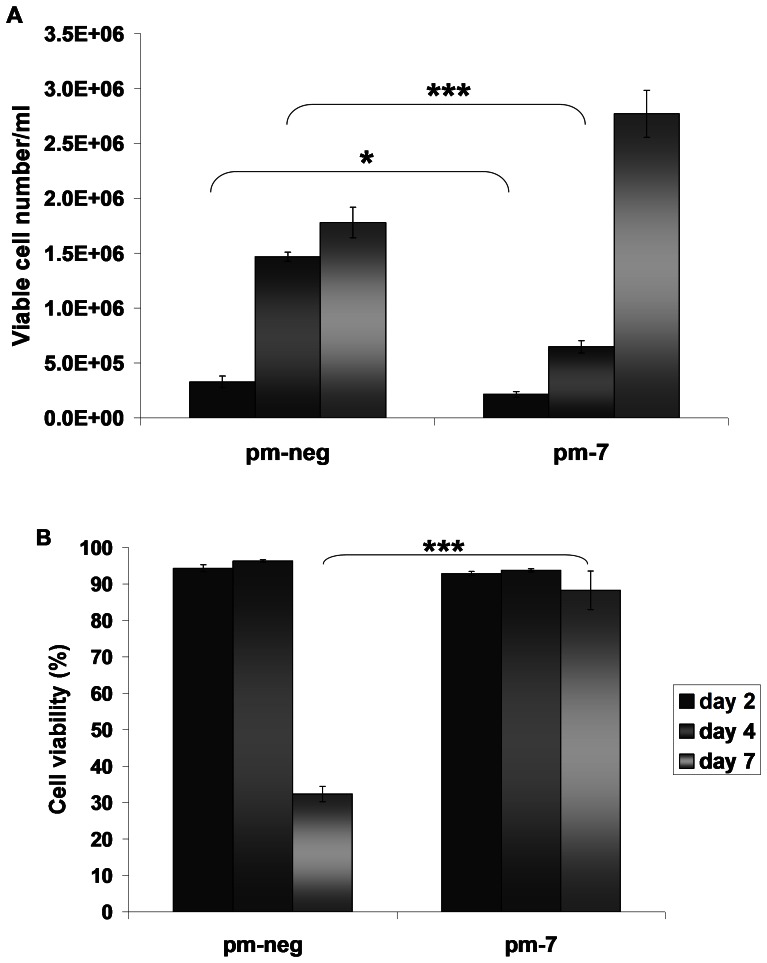
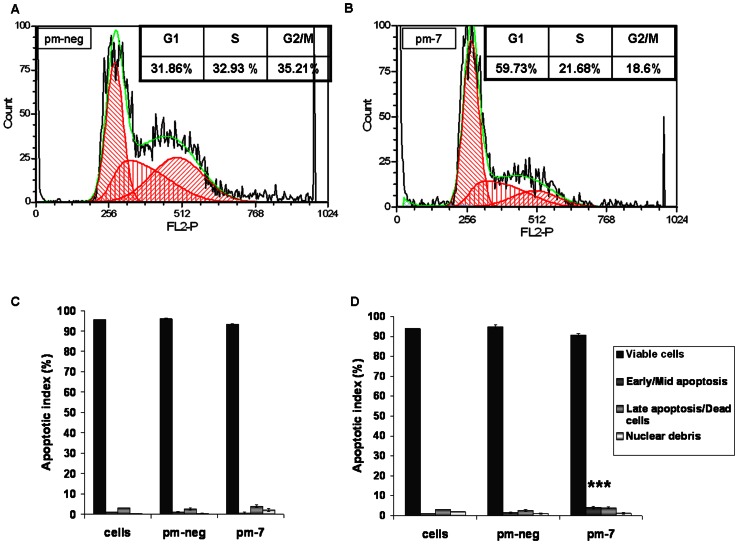
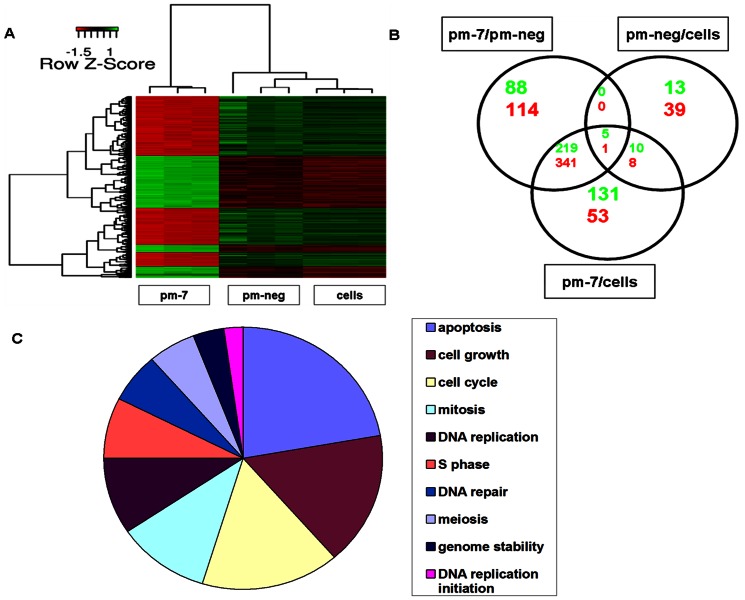
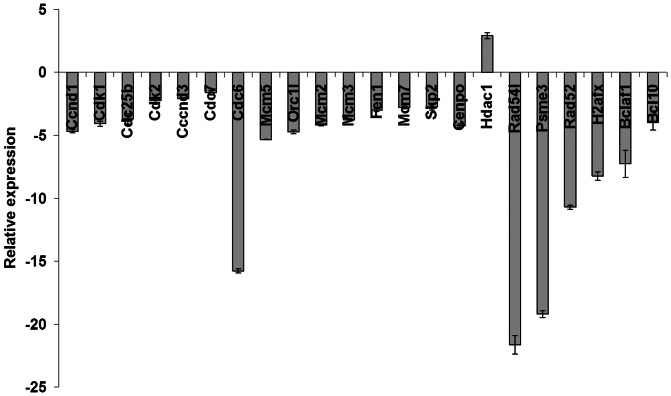
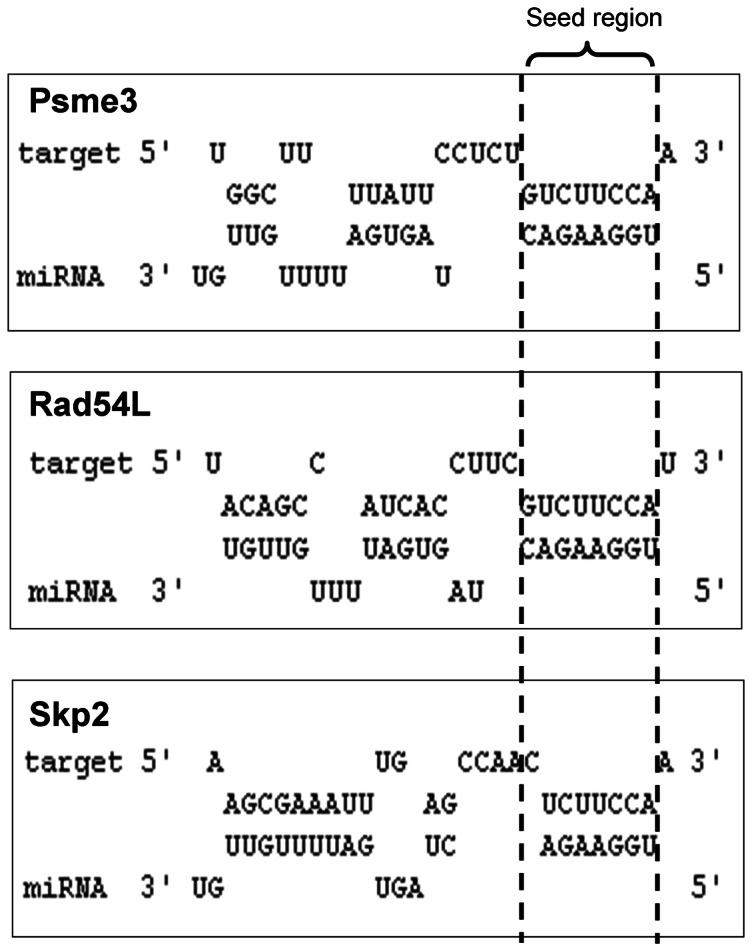
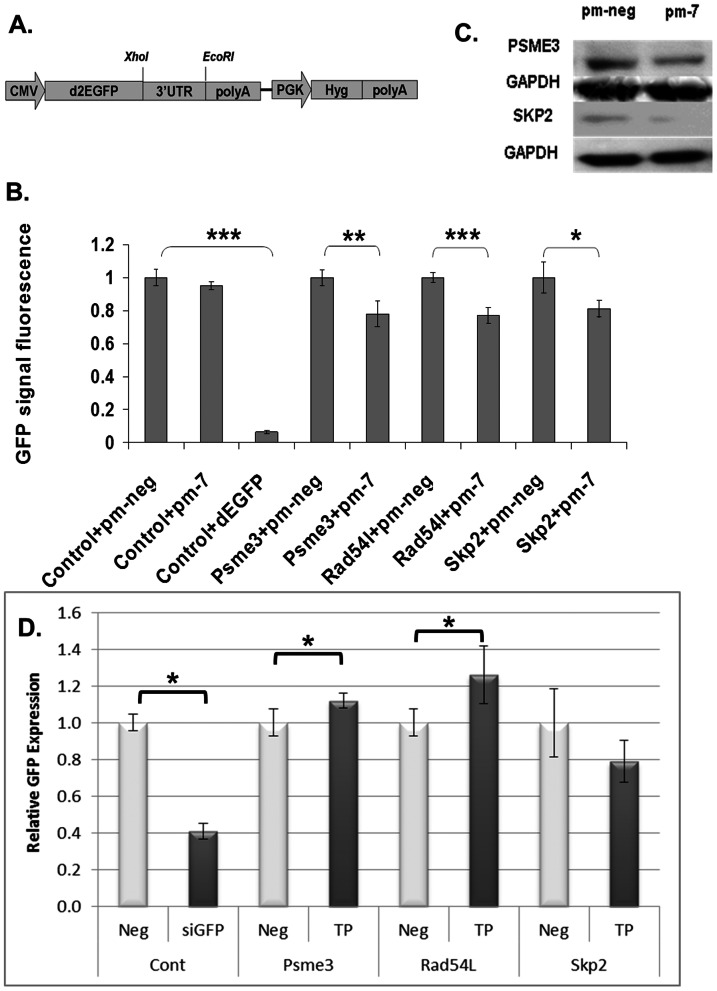
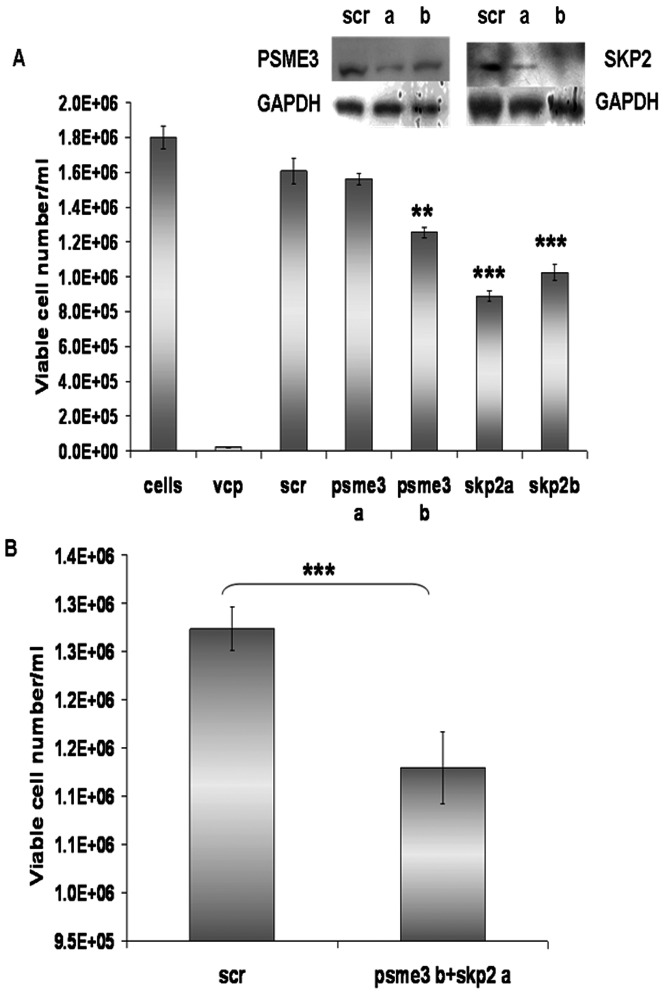
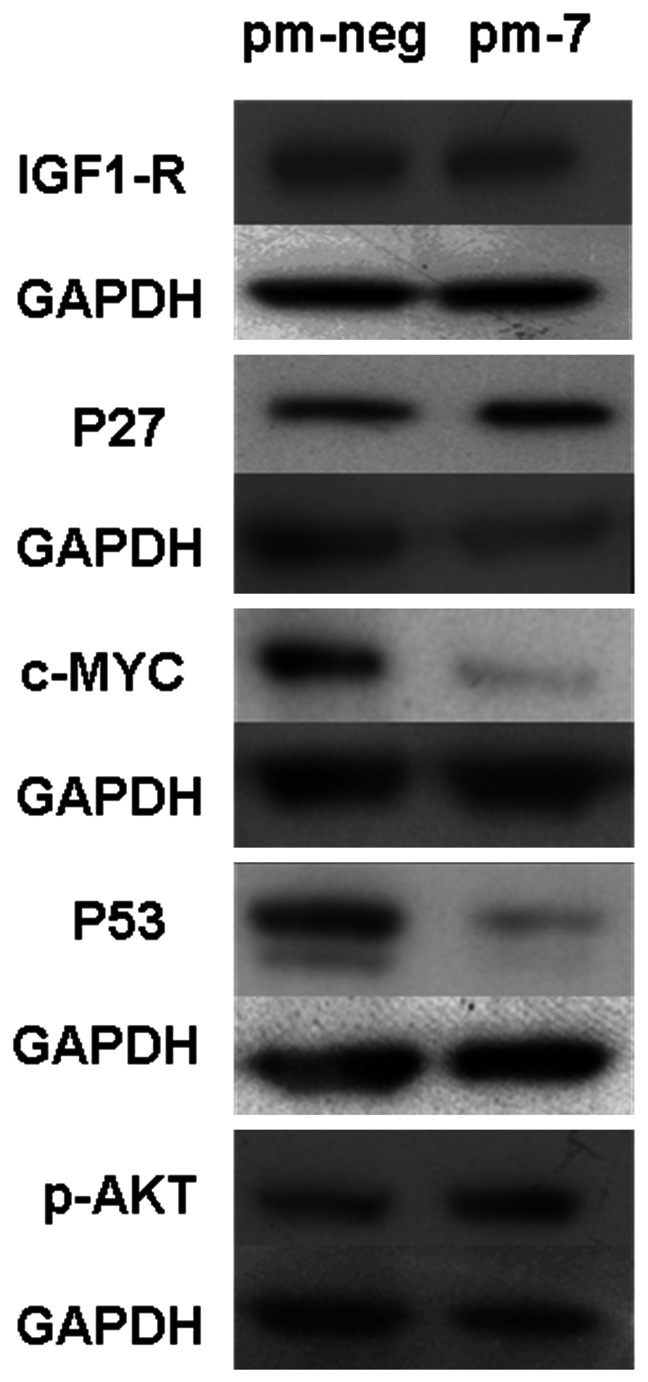
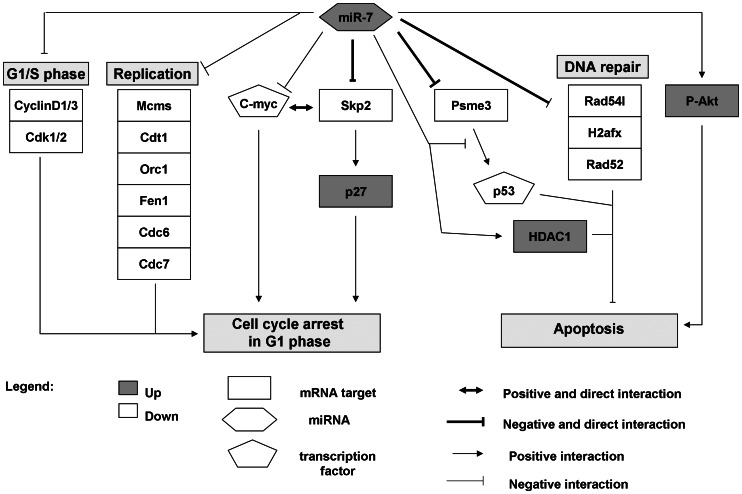
MiR-7 acts as a tumour suppressor in many cancers and abrogates proliferation of CHO cells in culture. In this study we demonstrate that miR-7 targets key regulators of the G1 to S phase transition, including Skp2 and Psme3, to promote increased levels of p27(KIP) and temporary growth arrest of CHO cells in the G1 phase. Simultaneously, the down-regulation of DNA repair-specific proteins via miR-7 including Rad54L, and pro-apoptotic regulators such as p53, combined with the up-regulation of anti-apoptotic factors like p-Akt, promoted cell survival while arrested in G1. Thus miR-7 can co-ordinate the levels of multiple genes and proteins to influence G1 to S phase transition and the apoptotic response in order to maintain cellular homeostasis. This work provides further mechanistic insight into the role of miR-7 as a regulator of cell growth in times of cellular stress.


Conflict of interest statement

Competing Interests: Pfizer, Inc., provided access to their proprietary Wye3A Hamster microarray chip for this study. This does not alter the authors' adherence to all the PLOS ONE policies on sharing data and materials.

Figures

Figure 1
Figure 1. Impact of miR-7 transfection on cell growth (A) and cell viability (B).
Mimics of miR-7 (pm-7) or non-specific mimic controls (pm-neg) were transfected using 2 µl of NeoFx™ in CHO cells at a concentration of 50 nM. Cells were stained with GuavaViacount reagent to assess cell density and cell viability at day 2, day 4 and day 7. Standard deviations represent biological triplicates. Statistics were evaluated with a Student's t-test.*: p-value<0.05; ***: p-value<0.001.
Figure 2
Figure 2. Impact of miR-7 on cell cycle and apoptosis.
For cell cycle analysis, cells were stained with Guava Cell Cycle reagent at 3 days after treatment with pm-neg (A) or pm-7 (B). Apoptosis was evaluated with the Nexin assay reagent at day 3 (C) and day 5 (D) after transfection. The data were captured using a Guava Flow cytometer. FCS files from cell cycle assay were extracted and analysed using FCS Express Plus. Standard deviations represent four biological replicates. Significance was evaluated with a Student's t-test. ***: p-value<0.001.
Figure 3
Figure 3. MiR-7 does not induce senescence.
β-galactosidase activity was assayed after 96 hrs in cells treated with BrdU or transfected with pm-neg or pm-7. A: HCC1419 cells treated with 50 µM BrdU as positive control for senescence; B: pm-neg-treated CHO cells; C: pm-7-treated cells; D: CHO cells treated with 500 µM BrdU.
Figure 4
Figure 4. Transcriptomic analysis of miR-7 transfected cells.
Following pm-7 or pm-neg transfection, gene expression profiling was performed on biological triplicates using oligonucleotide arrays. Genes were considered to be differentially expressed and statistically significant if a 1.2 fold change in either direction was observed along with a Bonferroni adjusted p-value<0.05. Using the LIMMA method and Bonferroni algorithm, gene expression between the three groups was evaluated and compared (A). Unique and commonly differentially expressed probesets across the three comparisons were identified (B). Red: Down-regulated; Blue: Up-regulated. The biological processes most significantly represented by these DE genes were identified in silico using PANTHER and Pathway Studio (C).
Figure 5
Figure 5. Validation of miR-7 targets.
Genes involved in cell cycle regulation and DNA repair were validated by qRT-PCR. Relative expression was calculated using the 2−ΔΔCt method with β-actin used as an endogenous control.
Figure 6
Figure 6. Binding sites of miR-7 predicted in Psme3, Rad54L and Skp2.
The mature sequence of cgr-miR-7 was aligned with the sequences of its CHO mRNA targets, Psme3 (A), Skp2 (B) and Rad54L (C) using RNAhybrid .
Figure 7
Figure 7. Psme3, Rad54L and Skp2 are direct targets of miR-7.
The 3′UTR sequences of Psme3, Skp2 and part of the coding sequence plus the 3′UTR of Rad54L were inserted between XhoI and EcoRI restriction sites of the CMV-deGFP reporter vector (A). Following co-transfection of 1 µg of reporter with 50 nM of miR-7, GFP fluorescence was analysed using a Guava Easycyte96 system (B). The control was the CMV-deGFP vector. An siRNA against deGFP (dEGFP) was included as a positive control. Levels of endogenous PSME3 and SKP2 proteins were also investigated by western blotting following transfection with PM-Neg or PM-7 (C). Standard deviations represent biological triplicates. Cells were also co-transfected with reporter plasmids (0.5 ug/well in 24w-plate) and 500 nM of site-specific (TP) or control (Neg) target protector oligonucleotides to block miR-7 access to the predicted binding sites. A CMV-GFP vector was co-transfected with non-specific (Neg) or GFP-specific (siGFP) siRNA to ensure transfection efficiency (n = 6) (D). Significance was evaluated with a Student's t-test.*: p-value<0.05; **: p-value<0.01; ***: p-value<0.001.
Figure 8
Figure 8. Impact of Psme3 and Skp2 on cell proliferation.
Two siRNAs (a&b) for Psme3 and Skp2 were transfected separately (A) or simultaneously (B) at a final concentration of 50 nM. Cell growth was assessed at day 3 after transfection. Knockdown of PSME3 and SKP2 was confirmed by western blotting (A). GAPDH was used as a loading control. Error bars represent standard deviations across biological triplicates. Significance was evaluated with a Sztudent's t-test. **: p-value<0.01; ***: p-value<0.001.
Figure 9
Figure 9. Expression of IGF1-R, p27, c-MYC, p53 and p-AKT in cells transfected with either a non-specific mimic (pm-neg) or miR-7 mimic (pm-7).
GAPDH was used as a loading control.
Figure 10
Figure 10. Model network of miR-7 interaction.
In purple are the down-regulated mRNA targets and in green the up-regulated mRNA targets. Down-regulated transcription factors are coloured in blue. The bold lines represent direct interactions. The other lines are hypothetical interactions.

Similar articles

Cited by

References

    1. Hu H, Gatti RA (2011) MicroRNAs: New players in the DNA damage response. J Mol Cell Biol 3: 151–8. - PMC - PubMed
    1. Ichimura A, Ruike Y, Terasawa K, Tsujimoto G (2011) miRNAs and regulation of cell signaling. FEBS J 278: 1610–8. - PubMed
    1. Cannell IG, Bushell M (2010) Regulation of myc by miR-34c: A mechanism to prevent genomic instability? Cell Cycle 9: 2726–30. - PubMed
    1. Ambros V, Bartel B, Bartel DP, Burge CB, Carrington JC, et al. (2003) A uniform system for microRNA annotation. RNA 9: 277–9. - PMC - PubMed
    1. Lewis BP, Burge CB, Bartel DP (2008) Conserved seed pairing, often flanked by adenosines, indicates that thousands of human genes are microRNA targets. Cell 120: 15–20. - PubMed

Publication types

MeSH terms