

MRI markers for mild cognitive impairment: comparisons between white matter integrity and gray matter volume measurements
- PMID: 23762488
- PMCID: PMC3675142
- DOI: 10.1371/journal.pone.0066367
MRI markers for mild cognitive impairment: comparisons between white matter integrity and gray matter volume measurements
Abstract
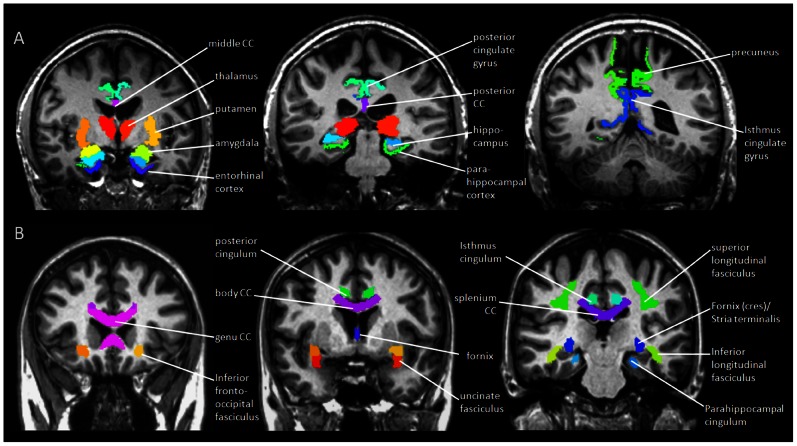
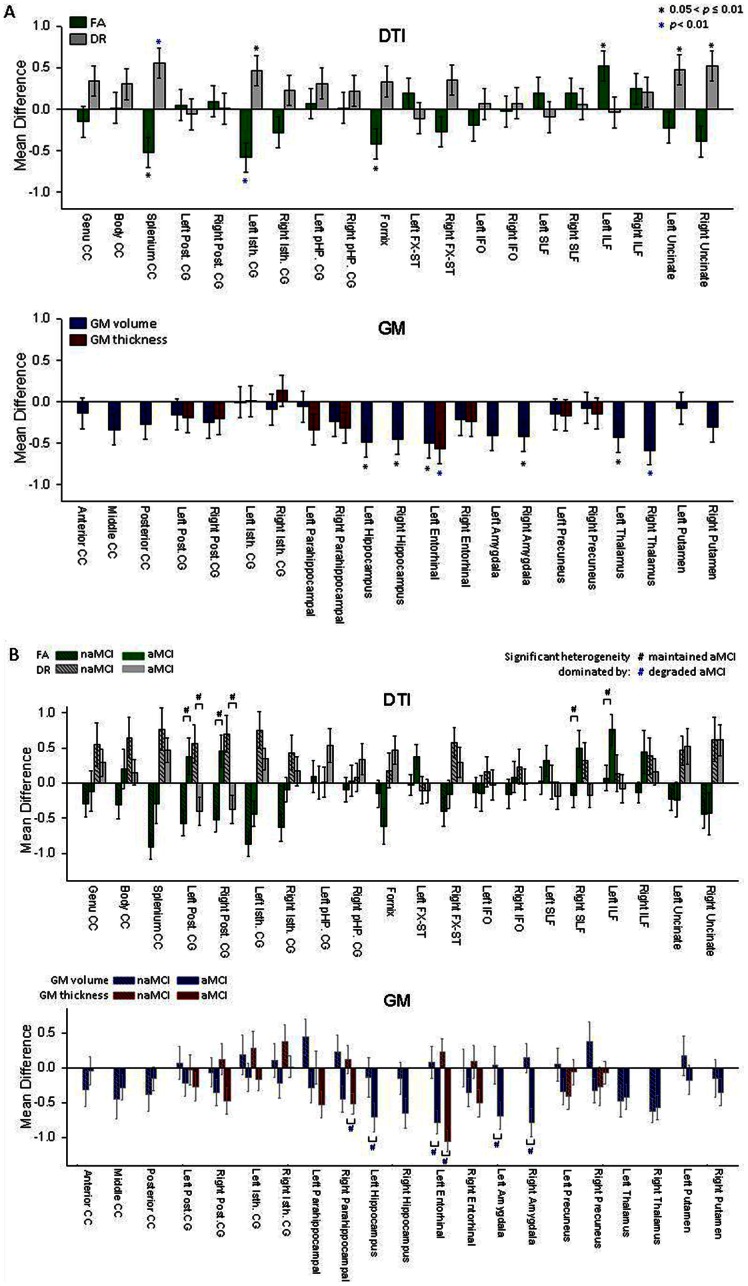
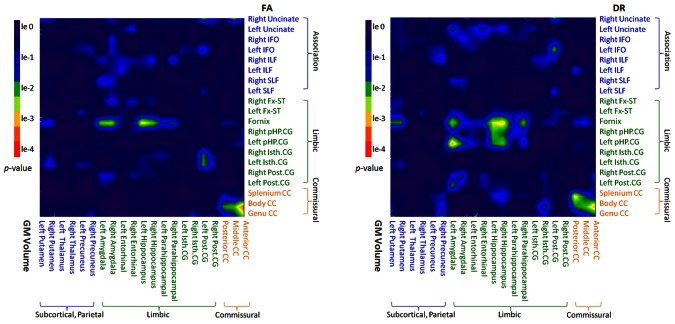
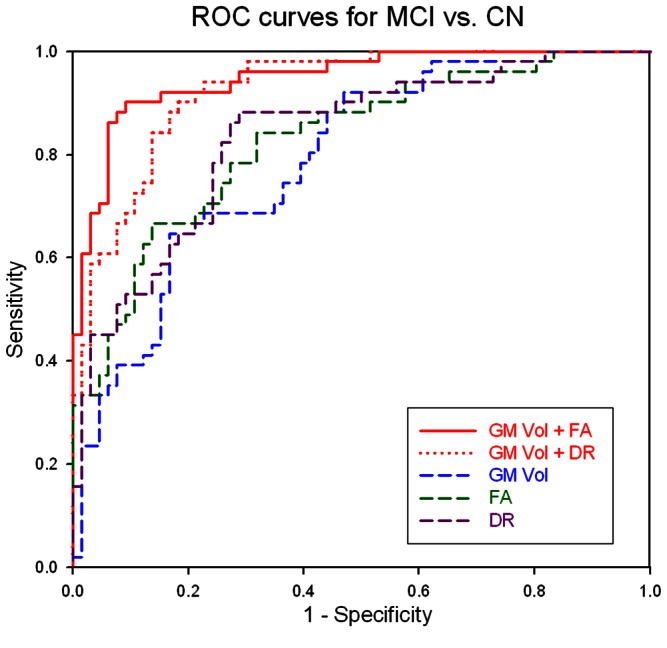
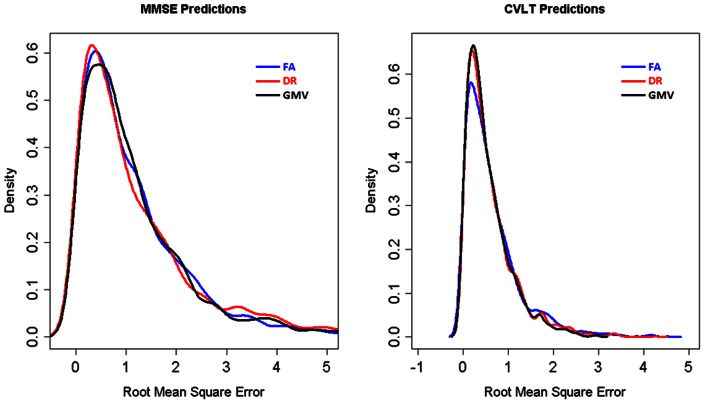
The aim of the study was to evaluate the value of assessing white matter integrity using diffusion tensor imaging (DTI) for classification of mild cognitive impairment (MCI) and prediction of cognitive impairments in comparison to brain atrophy measurements using structural MRI. Fifty-one patients with MCI and 66 cognitive normal controls (CN) underwent DTI and T1-weighted structural MRI. DTI measures included fractional anisotropy (FA) and radial diffusivity (DR) from 20 predetermined regions-of-interest (ROIs) in the commissural, limbic and association tracts, which are thought to be involved in Alzheimer's disease; measures of regional gray matter (GM) volume included 21 ROIs in medial temporal lobe, parietal cortex, and subcortical regions. Significant group differences between MCI and CN were detected by each MRI modality: In particular, reduced FA was found in splenium, left isthmus cingulum and fornix; increased DR was found in splenium, left isthmus cingulum and bilateral uncinate fasciculi; reduced GM volume was found in bilateral hippocampi, left entorhinal cortex, right amygdala and bilateral thalamus; and thinner cortex was found in the left entorhinal cortex. Group classifications based on FA or DR was significant and better than classifications based on GM volume. Using either DR or FA together with GM volume improved classification accuracy. Furthermore, all three measures, FA, DR and GM volume were similarly accurate in predicting cognitive performance in MCI patients. Taken together, the results imply that DTI measures are as accurate as measures of GM volume in detecting brain alterations that are associated with cognitive impairment. Furthermore, a combination of DTI and structural MRI measurements improves classification accuracy.
Conflict of interest statement
Figures
Similar articles
-
Multiple DTI index analysis in normal aging, amnestic MCI and AD. Relationship with neuropsychological performance.Neurobiol Aging. 2012 Jan;33(1):61-74. doi: 10.1016/j.neurobiolaging.2010.02.004. Epub 2010 Apr 3. Neurobiol Aging. 2012. PMID: 20371138
-
Disruption of limbic white matter pathways in mild cognitive impairment and Alzheimer's disease: a DTI/FDG-PET study.Hum Brain Mapp. 2012 Aug;33(8):1792-802. doi: 10.1002/hbm.21320. Epub 2011 Jun 14. Hum Brain Mapp. 2012. PMID: 21674695 Free PMC article.
-
Magnetic resonance diffusion tensor imaging for detecting the cerebral microstructure changes in patients with CSVD-induced mild cognitive impairment.J Neurophysiol. 2024 Dec 1;132(6):1937-1942. doi: 10.1152/jn.00408.2024. Epub 2024 Nov 6. J Neurophysiol. 2024. PMID: 39503583
-
Diffusion tensor imaging in Alzheimer's disease and mild cognitive impairment.Behav Neurol. 2009;21(1):39-49. doi: 10.3233/BEN-2009-0234. Behav Neurol. 2009. PMID: 19847044 Free PMC article. Review.
-
The role of diffusion tensor imaging in detecting microstructural changes in prodromal Alzheimer's disease.CNS Neurosci Ther. 2014 Jan;20(1):3-9. doi: 10.1111/cns.12166. Epub 2013 Dec 12. CNS Neurosci Ther. 2014. PMID: 24330534 Free PMC article. Review.
Cited by
-
Evaluating the reliability of neurocognitive biomarkers of neurodegenerative diseases across countries: A machine learning approach.Neuroimage. 2020 Mar;208:116456. doi: 10.1016/j.neuroimage.2019.116456. Epub 2019 Dec 10. Neuroimage. 2020. PMID: 31841681 Free PMC article.
-
Fractional anisotropy of the fornix and hippocampal atrophy in Alzheimer's disease.Front Aging Neurosci. 2014 Nov 13;6:316. doi: 10.3389/fnagi.2014.00316. eCollection 2014. Front Aging Neurosci. 2014. PMID: 25431558 Free PMC article. Review.
-
Combining multiple anatomical MRI measures improves Alzheimer's disease classification.Hum Brain Mapp. 2016 May;37(5):1920-9. doi: 10.1002/hbm.23147. Epub 2016 Feb 25. Hum Brain Mapp. 2016. PMID: 26915458 Free PMC article.
-
Thalamic Shape and Cognitive Performance in Amnestic Mild Cognitive Impairment.Psychiatry Investig. 2016 Sep;13(5):504-510. doi: 10.4306/pi.2016.13.5.504. Epub 2016 Sep 30. Psychiatry Investig. 2016. PMID: 27757128 Free PMC article.
-
Brain White Matter: A Substrate for Resilience and a Substance for Subcortical Small Vessel Disease.Brain Sci. 2019 Aug 8;9(8):193. doi: 10.3390/brainsci9080193. Brain Sci. 2019. PMID: 31398858 Free PMC article.
References
-
- Albert MS, DeKosky ST, Dickson D, Dubois B, Feldman HH, et al. (2011) The diagnosis of mild cognitive impairment due to Alzheimer's disease: recommendations from the National Institute on Aging-Alzheimer's Association workgroups on diagnostic guidelines for Alzheimer's disease. Alzheimers Dement 7: 270–279. - PMC - PubMed
-
- Ramani A, Jensen JH, Helpern JA (2006) Quantitative MR imaging in Alzheimer disease. Radiology 241: 26–44. - PubMed
-
- Frisoni GB, Padovani A, Wahlund LO (2003) The diagnosis of Alzheimer disease before it is Alzheimer dementia. Arch Neurol 60: 1023; author reply 1023–1024. - PubMed
-
- Sluimer JD, Bouwman FH, Vrenken H, Blankenstein MA, Barkhof F, et al. (2010) Whole-brain atrophy rate and CSF biomarker levels in MCI and AD: a longitudinal study. Neurobiol Aging 31: 758–764. - PubMed
Publication types
MeSH terms
Substances
Grants and funding
LinkOut - more resources
Full Text Sources
Other Literature Sources
Medical
