. 2013 Jul 11;5(3):183-93.
doi: 10.1042/AN20120032.

Egr-1 is a critical regulator of EGF-receptor-mediated expansion of subventricular zone neural stem cells and progenitors during recovery from hypoxia-hypoglycemia

Affiliations

Egr-1 is a critical regulator of EGF-receptor-mediated expansion of subventricular zone neural stem cells and progenitors during recovery from hypoxia-hypoglycemia

Dhivyaa Alagappan et al. ASN Neuro. .

Abstract

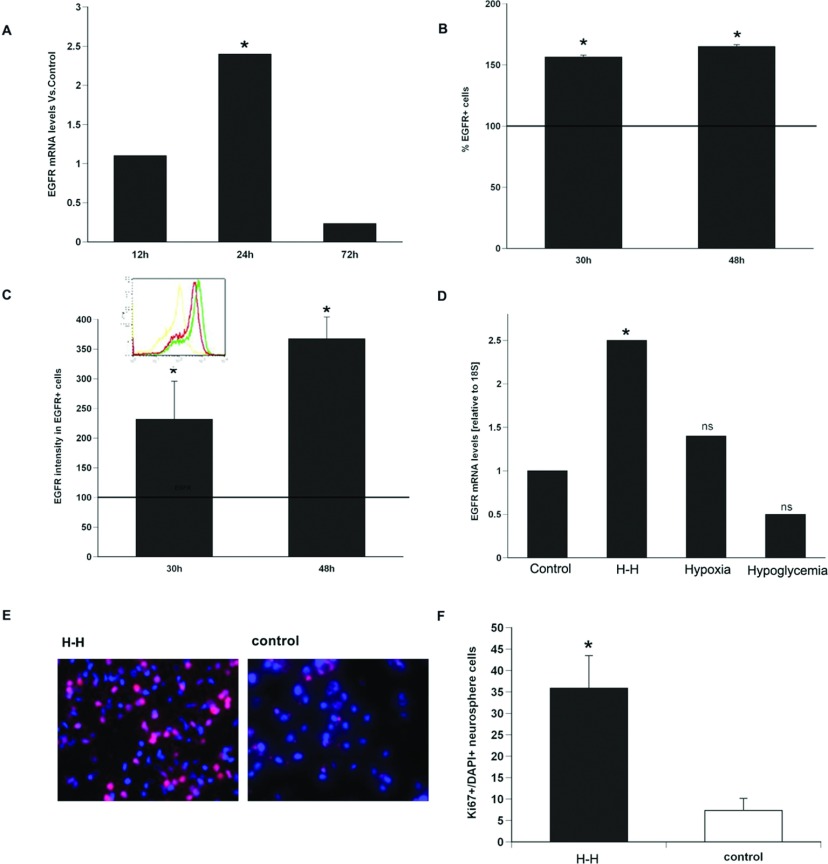
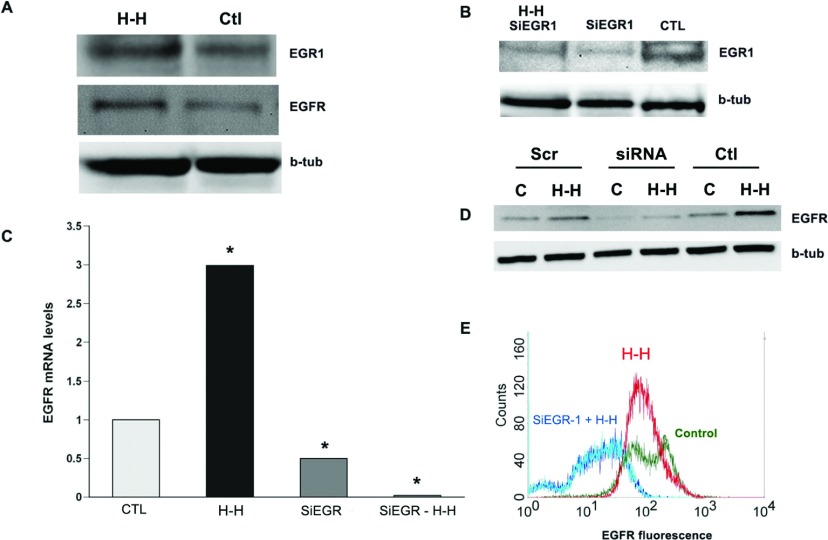
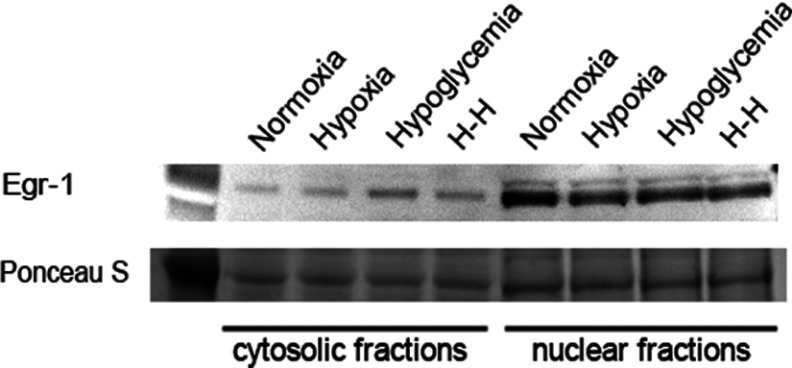
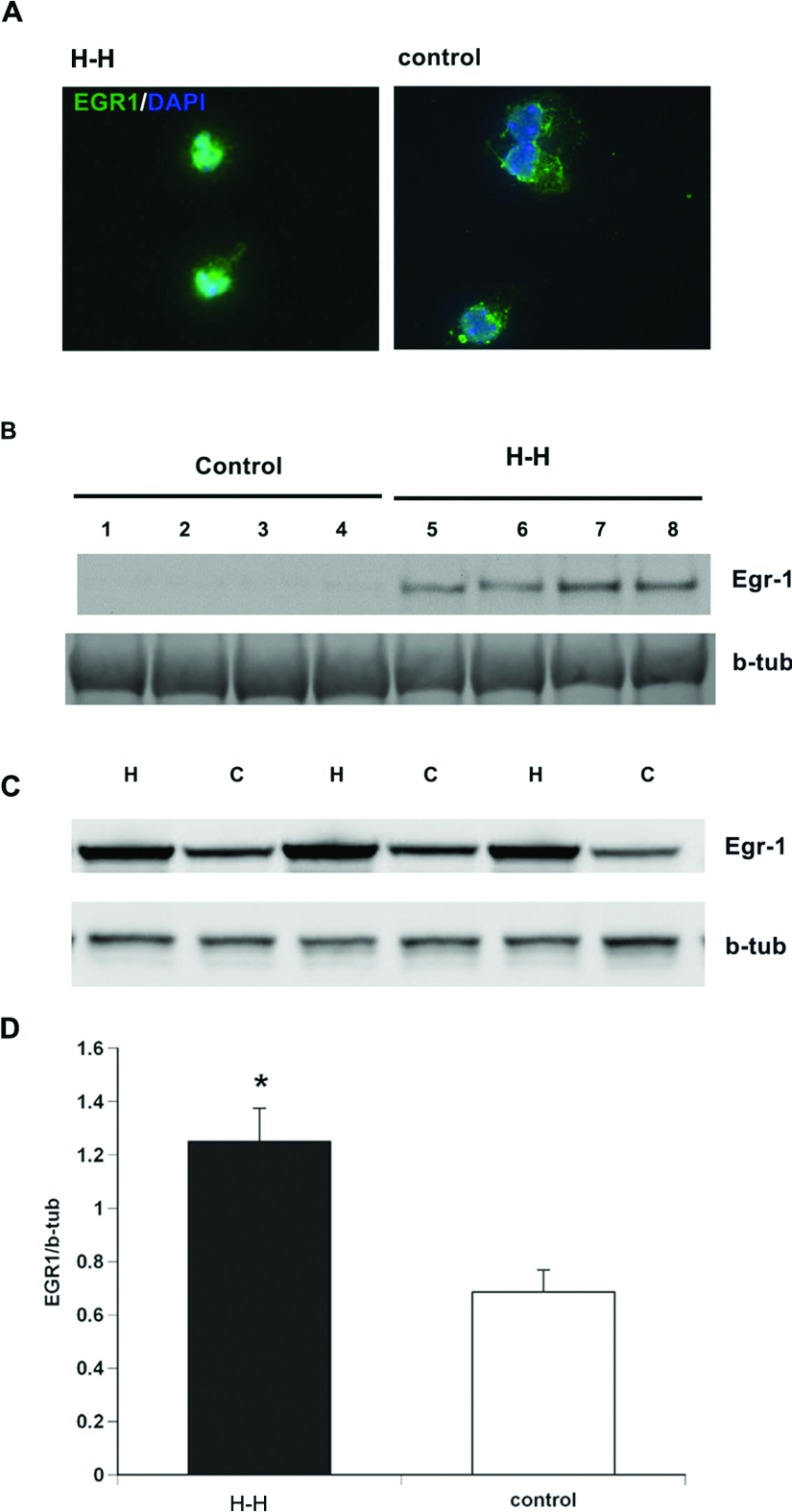
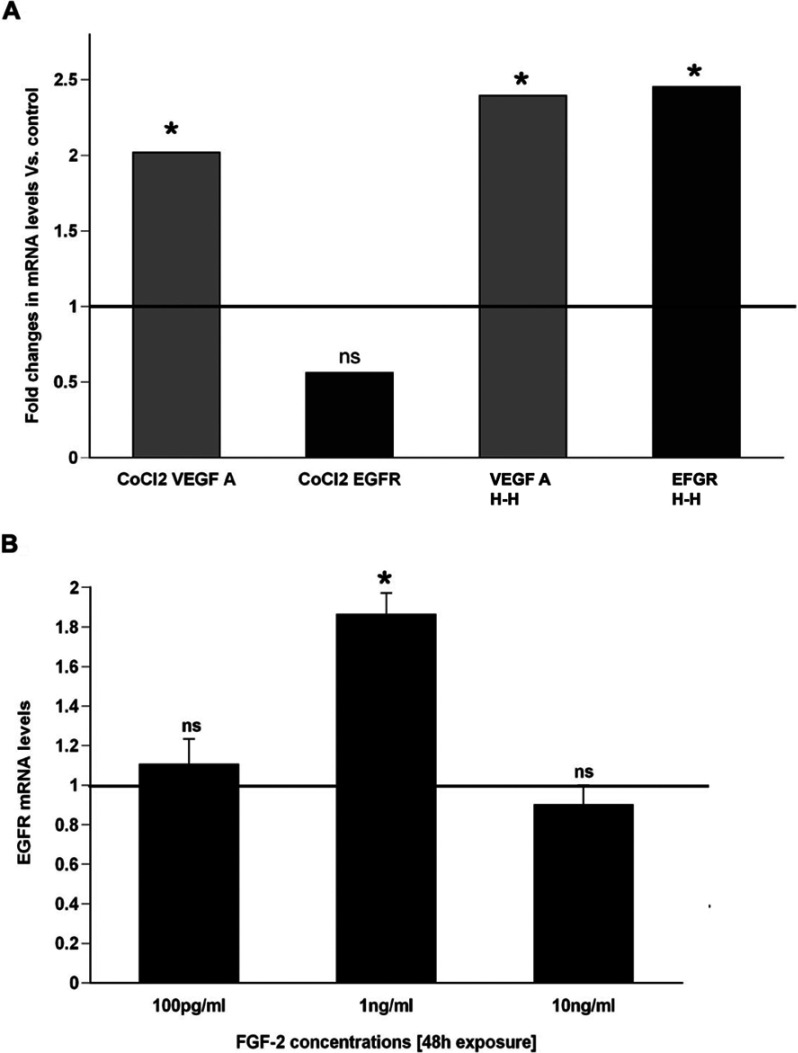
We recently established that the EGF-R (epidermal growth factor receptor) (EGF-R) is an essential regulator of the reactive expansion of SVZ (subventricular zone) NPs (neural precursors) that occurs during recovery from hypoxic-ischemic brain injury. The purpose of the current studies was to identify the conditions and the transcription factor (s) responsible for inducing the EGF-R. Here, we show that the increase in EGF-R expression and the more rapid division of the NPs can be recapitulated in in vitro by exposing SVZ NPs to hypoxia and hypoglycemia simultaneously, but not separately. The EGF-R promoter has binding sites for multiple transcription factors that includes the zinc finger transcription factor, Egr-1. We show that Egr-1 expression increases in NPs, but not astrocytes, following hypoxia and hypoglycemia where it accumulates in the nucleus. To determine whether Egr-1 is necessary for EGF-R expression, we used SiRNAs (small interfering RNA) specific for Egr-1 to decrease Egr-1 expression. Knocking-down Egr-1 decreased basal levels of EGF-R and it abolished the stress-induced increase in EGF-R expression. By contrast, HIF-1 accumulation did not contribute to EGF-R expression and FGF-2 only modestly induced EGF-R. These studies establish a new role for Egr-1 in regulating the expression of the mitogenic EGF-R. They also provide new information into mechanisms that promote NP expansion and provide insights into strategies for amplifying the numbers of stem cells for CNS (central nervous system) regeneration.


Figures

Figure 1
Figure 1. EGF-R induction and cell division can be recapitulated in vitro in the absence of a brain cell niche
(A) Q-PCR using primers specific for EGF-R and normalized to expression of 18S at 12, 24 and 72 h after in vitro HH on rat NPs. (B) Quantification of the EGF-R expressing cells and (C) EGF-R intensity within NPs at 30 and 48 h after in vitro HH. (D) EGF-R mRNA at 24 h after exposure of NPs to only hypoxia (2% O2) or only ischemia (3 mM glucose) or a combination of both. Solid line indicates EGF-R levels thee in untreated control NPs. Values are average±S.E.M. from three independent experiment with n=6 animals per experiment.*=P<0.05 by REST (relative expression software tool). (E) NP were exposed to H–H, allowed to recover for 30 h and then labelled for Ki67 (red) and counterstained with DAPI (blue). (F) Quantification of % Ki67/total cells. Values represent mean±S.E.M.*P<0.5 by Student's t test.
Figure 2
Figure 2. The increase in EGF-R requires Egr-1
(A) Rat NPs were subjected to in vitro H–H (3 mM glucose media and 2% O2 for 4 h) after which the spheres were lysed and analysed for the presence of Egr-1 accumulation and EGF-R. (B) Rat NPs were transfected with SiRNAs against Egr-1 and subjected to H–H and analysed for the expression of Egr-1. Control NPs were mock transfected and not subjected to H–I. β-tubulin was used as a loading control. (C) Q-PCR using primers specific for EGF-R normalized to 18S expression in rat NPs subjected to in vitro H–I with or without the transfection of SiRNAs to Egr-1. Control NPs were mock transfected and not subjected to H–I. (D) Cell lysates from spheres subjected to H–I (lanes b,d,f) and control spheres (lanes a,c,e) were analyed for EGF-R expression. Cells were transfected with SiRNAs against Egr-1 (lanes c,d) or random scrambled oligonucleotide sequences (lanes a,b). (E) Quantification of the EGF-R intensity by flow cytometry (in a.u.) within EGF-R expressing cells transfected with SiRNA to Egr-1 and untransfected NPs subjected to H–I in vitro. n=3 independent experiments with six animals per experiment.*=P<0.05 by REST (Pfaffl et al., 2002).
Figure 3
Figure 3. Egr-1 does not accumulate in astrocytes in response to hypoxic–hypoglycemic stress
Highly enriched cultures of neocortical astrocytes were generated from P1-2 rat pup mixed glial cell cultures and then maintained in a hormone-supplemented medium for 2 days to promote differentiation. The astrocytes were exposed to 4 h of either hypoxia alone (2% O2), hypoglycemia alone (3 mM glucose) or H–H (3 mM glucose media and 2% O2 for 4 h) and then returned to standard culture conditions for 24 h whereupon the cells were subjected to subcellular fractionation and analysed for the presence of Egr-1 accumulation. Data are representative of three independent experiments.
Figure 4
Figure 4. Egr-1 accumulates in the nucleus following H–I and binds the EGF-R promoter
(A) Rat neurospheres were subjected to H–H and stained for Egr-1 (green) and counterstained with DAPI (blue). (B) Nuclear extracts from neurospheres subjected to H–H and control neurospheres and probed with antibodies specific to Egr-1. (C) Egr-1 levels in NPs subjected to hypoxia alone compared with control NPs. (D) Densitometric quantification of Western blots. Values represent mean±S.E.M.*P<0.05 by Student's t test.
Figure 5
Figure 5. FGF weakly induces EGF-R
(A) 300 mM CoCl2 was used to induce HIF-1 and the levels of EGF-R mRNA were analysed using Q-PCR. VEGF mRNA was used as a positive control for HIF-1 induced transcription. (B) Primary neurospheres were generated in EGF (2 ng/ml) supplemented media and exposed to FGF-2 for 48 h following which the spheres were collected and the EGF-R levels were analysed by Q-PCR and normalized to 18S expression levels. Solid line indicates EGF-R levels in untreated control spheres. Values are average±S.E.M. from three independent experiment with n=6 animals per experiment.*P<0.05 by REST.

References

    1. Alagappan D. Ph.D. Thesis. Newark, NJ, U.S.A: University of Medicine and Dentistry of New Jersey; 2008. Brain injury expands the numbers of neural stem cells and progenitors in the SVZ by enhancing their responsiveness to EGF. - PMC - PubMed
    1. Alagappan D, Lazzarino DA, Felling RJ, Balan M, Kotenko SV, Levison SW. Brain injury expands the numbers of neural stem cells and progenitors in the SVZ by enhancing their responsiveness to EGF. ASN NEURO. 2009;1:art:e00009.doi:10.1042/AN20090002. - PMC - PubMed
    1. Arvidsson A, Collin T, Kirik D, Kokaia Z, Lindvall O. Neuronal replacement from endogenous precursors in the adult brain after stroke. Nat Med. 2002;8:963–970. - PubMed
    1. Bae S-K, Bae M-H, Ahn M-Y, Son MJ, Lee YM, Bae M-K, Lee O-H, Park BC, Kim K-W. Egr-1 Mediates Transcriptional Activation of IGF-II Gene in Response to Hypoxia. Cancer Res. 1999;59:5989–5994. - PubMed
    1. Bae M-H, Jeong C-H, Kim S-H, Bae M-K, Jeong J-W, Ahn M-Y, Bae S-K, Kim ND, Kim CW, Kim K-R, Kim K-W. Regulation of Egr-1 by association with the proteasome component C8. BBA-MCR. 2002;1592:163–167. - PubMed

Publication types

MeSH terms