

Comprehensive assessment and standardization of solid phase multiplex-bead arrays for the detection of antibodies to HLA
- PMID: 23763485
- PMCID: PMC3967448
- DOI: 10.1111/ajt.12287
Comprehensive assessment and standardization of solid phase multiplex-bead arrays for the detection of antibodies to HLA
Abstract
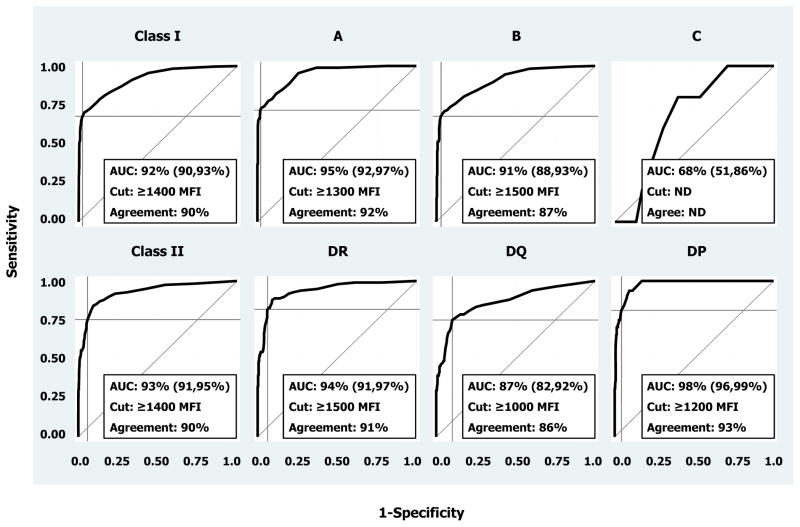
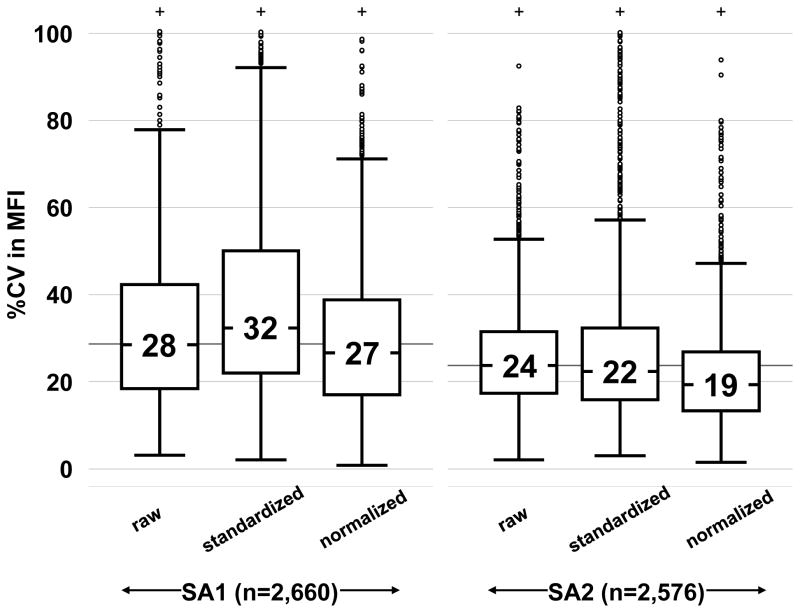
Solid phase multiplex-bead arrays for the detection and characterization of HLA antibodies provide increased sensitivity and specificity compared to conventional lymphocyte-based assays. Assay variability due to inconsistencies in commercial kits and differences in standard operating procedures (SOP) hamper comparison of results between laboratories. The Clinical Trials in Organ Transplantation Antibody Core Laboratories investigated sources of assay variation and determined if reproducibility improved through utilization of SOP, common reagents and normalization algorithms. Ten commercial kits from two manufacturers were assessed in each of seven laboratories using 20 HLA reference sera. Implementation of a standardized (vs. a nonstandardized) operating procedure greatly reduced MFI variation from 62% to 25%. Although laboratory agreements exceeded 90% (R(2) ), small systematic differences were observed suggesting center specific factors still contribute to variation. MFI varied according to manufacturer, kit, bead type and lot. ROC analyses showed excellent consistency in antibody assignments between manufacturers (AUC > 0.9) and suggested optimal cutoffs from 1000 to 1500 MFI. Global normalization further reduced MFI variation to levels near 20%. Standardization and normalization of solid phase HLA antibody tests will enable comparison of data across laboratories for clinical trials and diagnostic testing.
© Copyright 2013 The American Society of Transplantation and the American Society of Transplant Surgeons.
Conflict of interest statement
The authors of this manuscript have no conflicts of interest to disclose as described by the
Figures
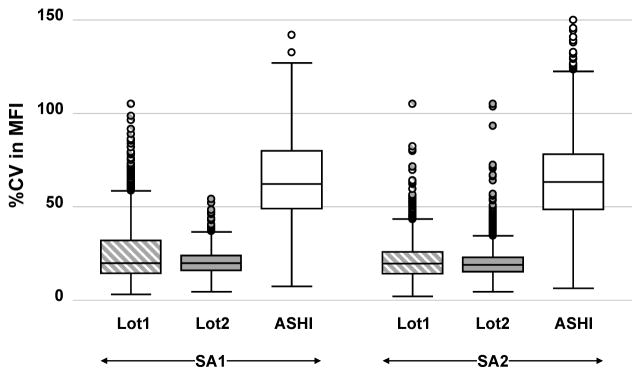
 and Lot2
 ) or with ASHI Proficiency Test materials processed under iHOP (□).
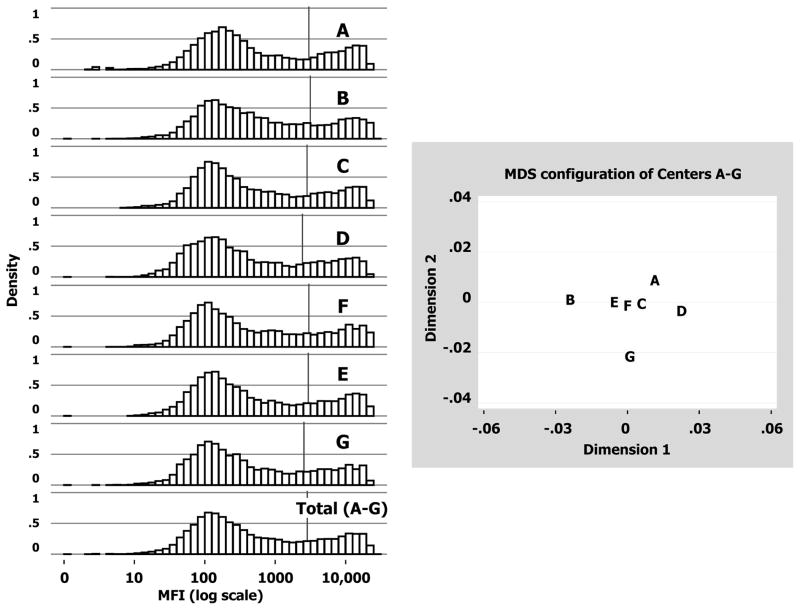
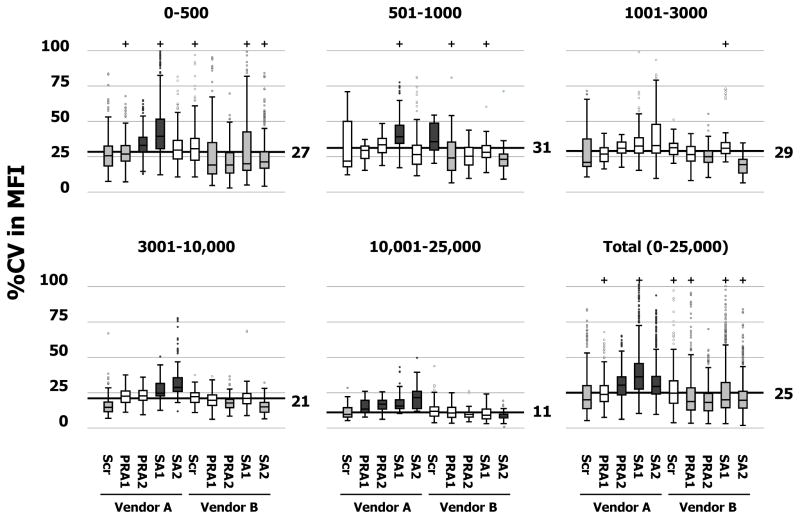
 , P<0.001); greater than median (
 , P<0.001).
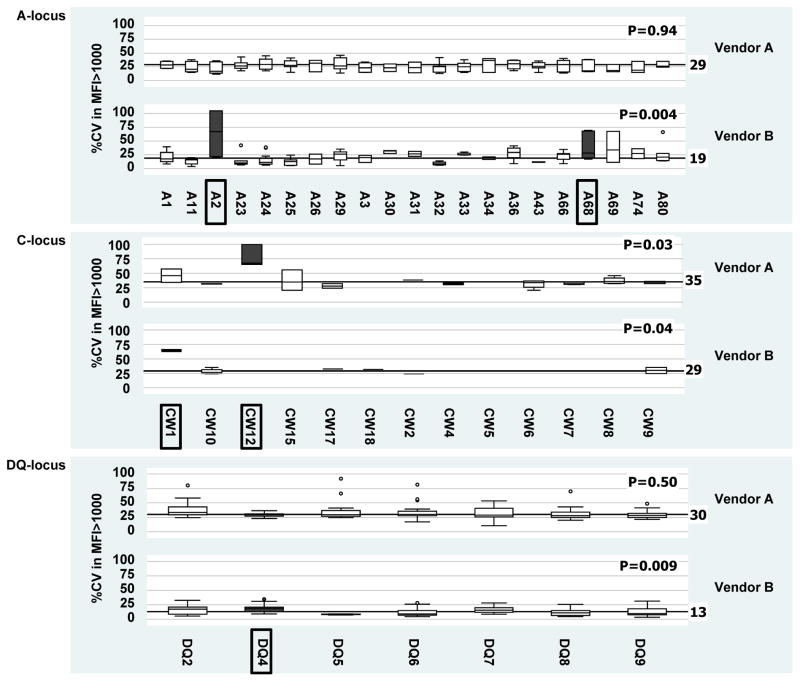 ). Only the A, C and DQ loci are shown since no significant SA bead anomalies were identified for the B, DR and DP loci.
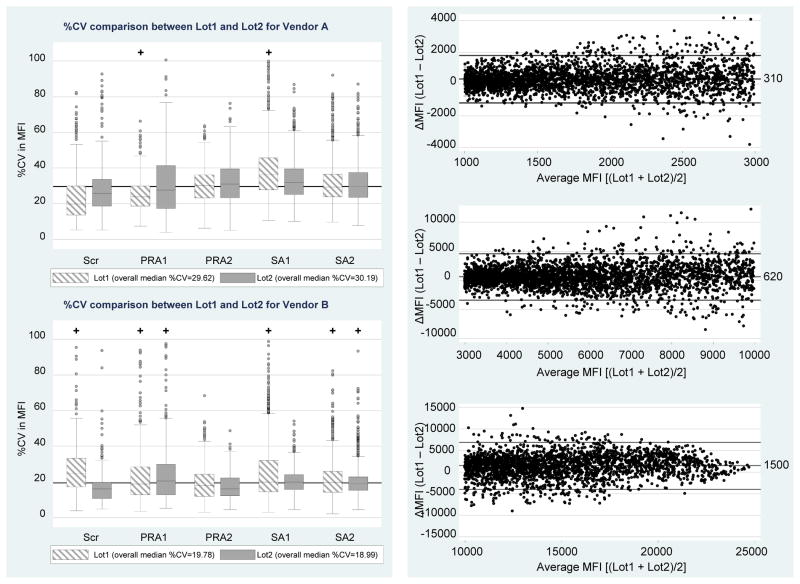
Comment in
-
Solid-phase bead-based assays limitations are not restricted to interlaboratory variability.Am J Transplant. 2013 Nov;13(11):3049. doi: 10.1111/ajt.12463. Epub 2013 Oct 1. Am J Transplant. 2013. PMID: 24119075 No abstract available.
Similar articles
-
Solid-phase bead-based assays limitations are not restricted to interlaboratory variability.Am J Transplant. 2013 Nov;13(11):3049. doi: 10.1111/ajt.12463. Epub 2013 Oct 1. Am J Transplant. 2013. PMID: 24119075 No abstract available.
-
Inter and intra laboratory concordance of HLA antibody results obtained by single antigen bead based assay.Hum Immunol. 2013 Mar;74(3):310-7. doi: 10.1016/j.humimm.2012.12.003. Epub 2012 Dec 10. Hum Immunol. 2013. PMID: 23238217
-
How can we reduce costs of solid-phase multiplex-bead assays used to determine anti-HLA antibodies?HLA. 2016 Sep;88(3):110-9. doi: 10.1111/tan.12860. Epub 2016 Aug 18. HLA. 2016. PMID: 27534609
-
Clinical cytometry and progress in HLA antibody detection.Methods Cell Biol. 2011;103:285-310. doi: 10.1016/B978-0-12-385493-3.00012-7. Methods Cell Biol. 2011. PMID: 21722808 Review.
-
Strategies for human leukocyte antigen antibody detection.Curr Opin Organ Transplant. 2009 Aug;14(4):392-7. doi: 10.1097/mot.0b013e32832d31c7. Curr Opin Organ Transplant. 2009. PMID: 19610172 Review.
Cited by
-
Interlaboratory Comparison of the Results of Lifecodes LSA Class I and Class II Single Antigen Kits for Human Leukocyte Antigen Antibody Detection.Ann Lab Med. 2015 May;35(3):321-8. doi: 10.3343/alm.2015.35.3.321. Epub 2015 Apr 1. Ann Lab Med. 2015. PMID: 25932440 Free PMC article.
-
Complement-activating donor-specific anti-HLA antibodies in solid organ transplantation: systematic review, meta-analysis, and critical appraisal.Front Immunol. 2023 Oct 2;14:1265796. doi: 10.3389/fimmu.2023.1265796. eCollection 2023. Front Immunol. 2023. PMID: 37849755 Free PMC article.
-
Impact of Subclinical Borderline Inflammation on Kidney Transplant Outcomes.Transplant Direct. 2021 Jan 26;7(2):e663. doi: 10.1097/TXD.0000000000001119. eCollection 2021 Feb. Transplant Direct. 2021. PMID: 33511268 Free PMC article.
-
HLA class, calcineurin inhibitor levels, and the risk of graft failure in kidney recipients with de novo donor-specific antibodies.Front Immunol. 2024 Nov 20;15:1493878. doi: 10.3389/fimmu.2024.1493878. eCollection 2024. Front Immunol. 2024. PMID: 39635538 Free PMC article.
-
Utility of HLA Antibody Testing in Kidney Transplantation.J Am Soc Nephrol. 2015 Jul;26(7):1489-502. doi: 10.1681/ASN.2014080837. Epub 2015 Mar 24. J Am Soc Nephrol. 2015. PMID: 25804279 Free PMC article. Review.
References
-
- Vaidya S. Clinical importance of anti-human leukocyte antigen-specific antibody concentration in performing calculated panel reactive antibody and virtual crossmatches. Transplantation. 2008;85(7):1046–50. Epub 2008/04/15. - PubMed
-
- Bray RA, Nolen JD, Larsen C, Pearson T, Newell KA, Kokko K, et al. Transplanting the highly sensitized patient: The emory algorithm. American journal of transplantation: official journal of the American Society of Transplantation and the American Society of Transplant Surgeons. 2006;6(10):2307–15. Epub 2006/08/31. - PubMed
-
- Cecka JM, Kucheryavaya AY, Reinsmoen NL, Leffell MS. Calculated PRA: initial results show benefits for sensitized patients and a reduction in positive crossmatches. American journal of transplantation: official journal of the American Society of Transplantation and the American Society of Transplant Surgeons. 2011;11(4):719–24. Epub 2010/12/01. - PubMed
-
- Colvin RB. Antibody-mediated renal allograft rejection: diagnosis and pathogenesis. Journal of the American Society of Nephrology: JASN. 2007;18(4):1046–56. Epub 2007/03/16. - PubMed
-
- Kobashigawa J, Crespo-Leiro MG, Ensminger SM, Reichenspurner H, Angelini A, Berry G, et al. Report from a consensus conference on antibody-mediated rejection in heart transplantation. The Journal of heart and lung transplantation: the official publication of the International Society for Heart Transplantation. 2011;30(3):252–69. Epub 2011/02/09. - PMC - PubMed
Publication types
MeSH terms
Substances
Grants and funding
LinkOut - more resources
Full Text Sources
Other Literature Sources
Molecular Biology Databases
Research Materials
