. 2013 Nov 1;22(21):2859-72.
doi: 10.1089/scd.2012.0693. Epub 2013 Jul 20.

Low osteogenic differentiation potential of placenta-derived mesenchymal stromal cells correlates with low expression of the transcription factors Runx2 and Twist2

Affiliations

Low osteogenic differentiation potential of placenta-derived mesenchymal stromal cells correlates with low expression of the transcription factors Runx2 and Twist2

Christine Ulrich et al. Stem Cells Dev. .

Abstract

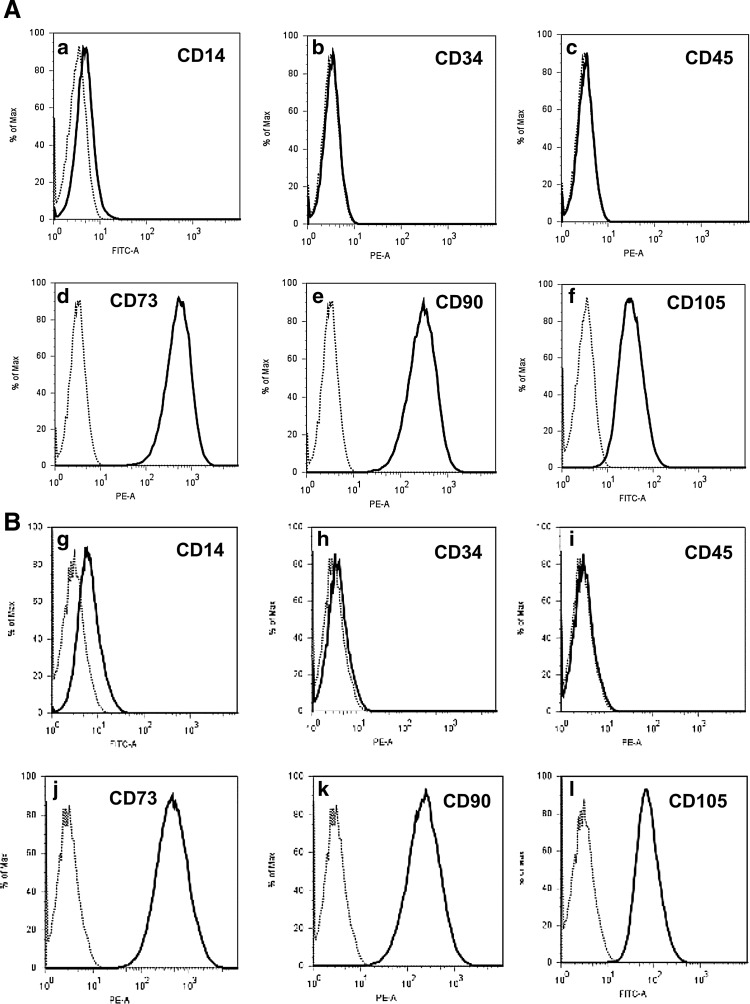
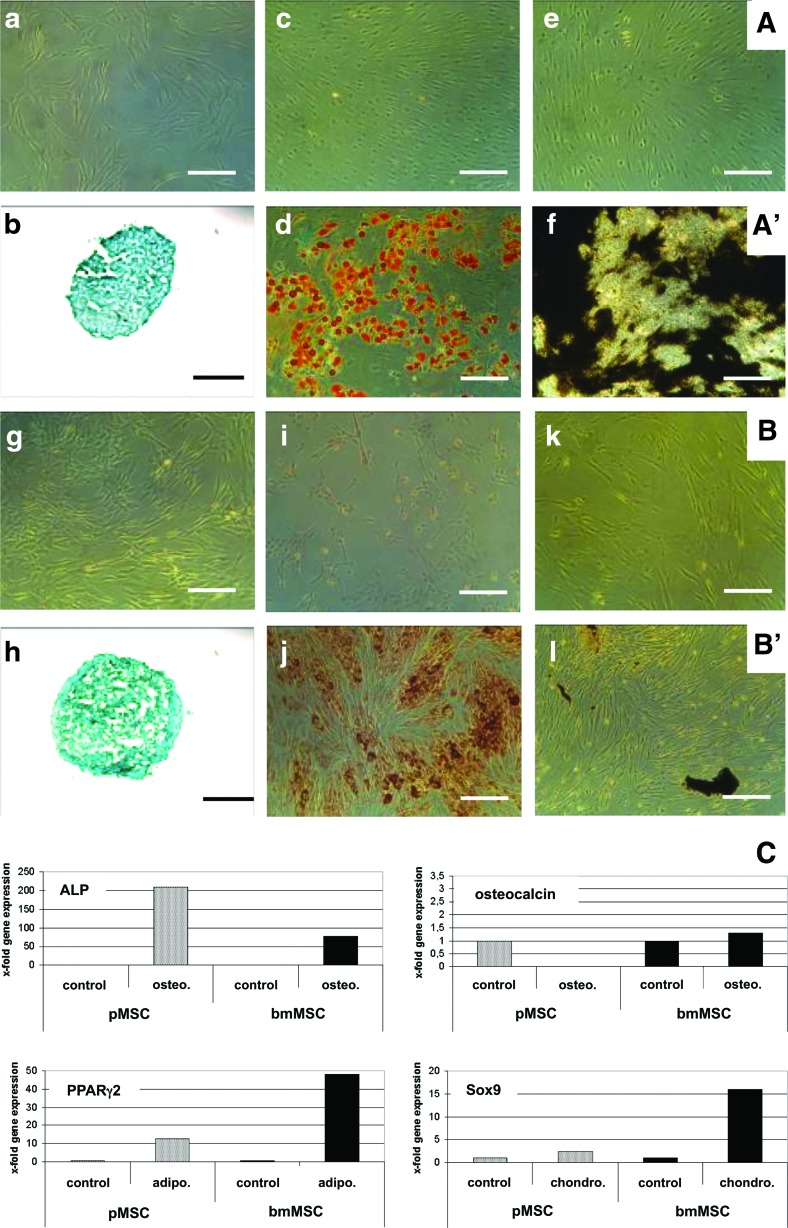
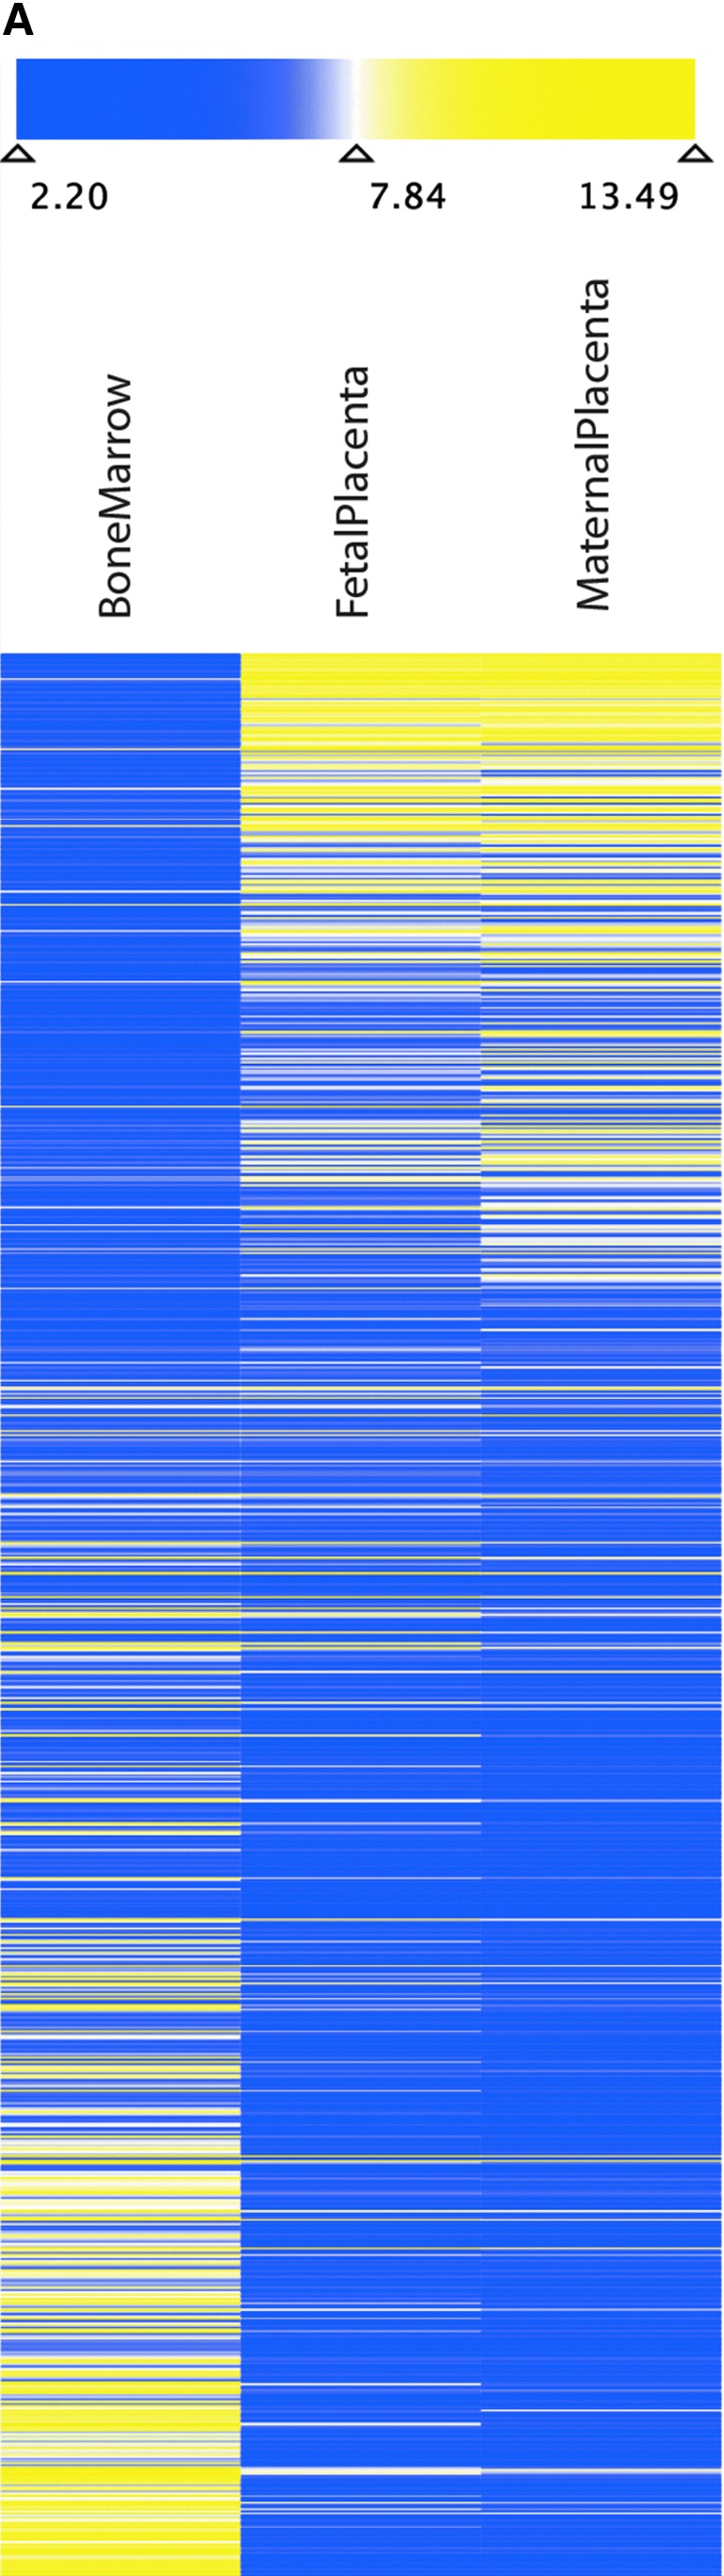
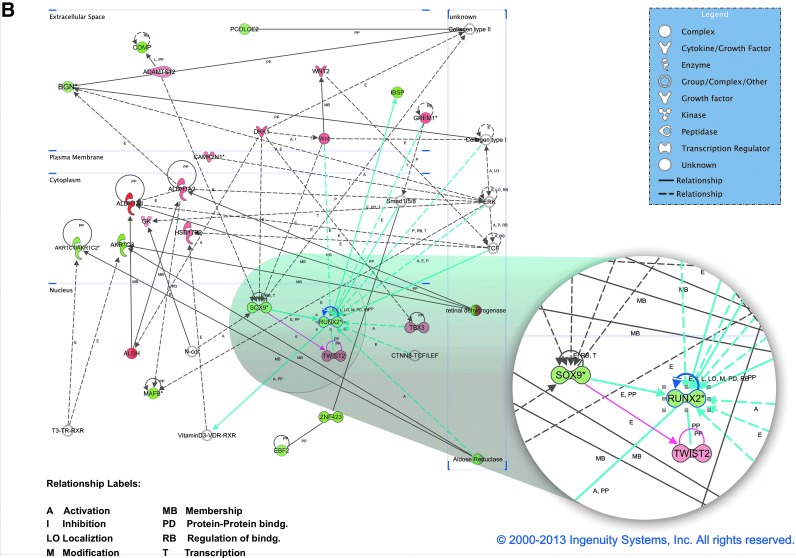
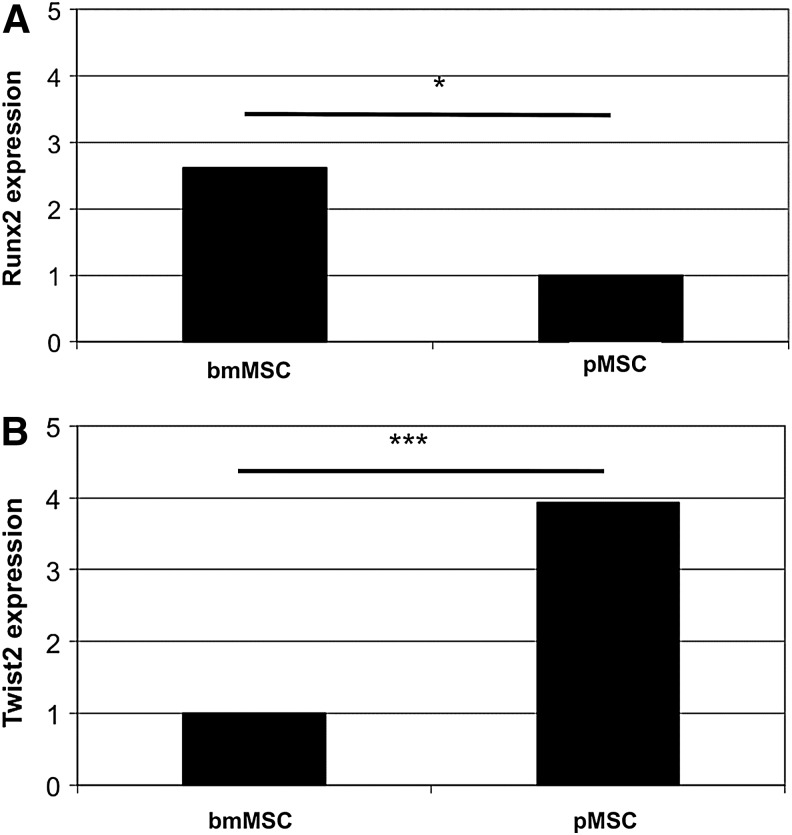
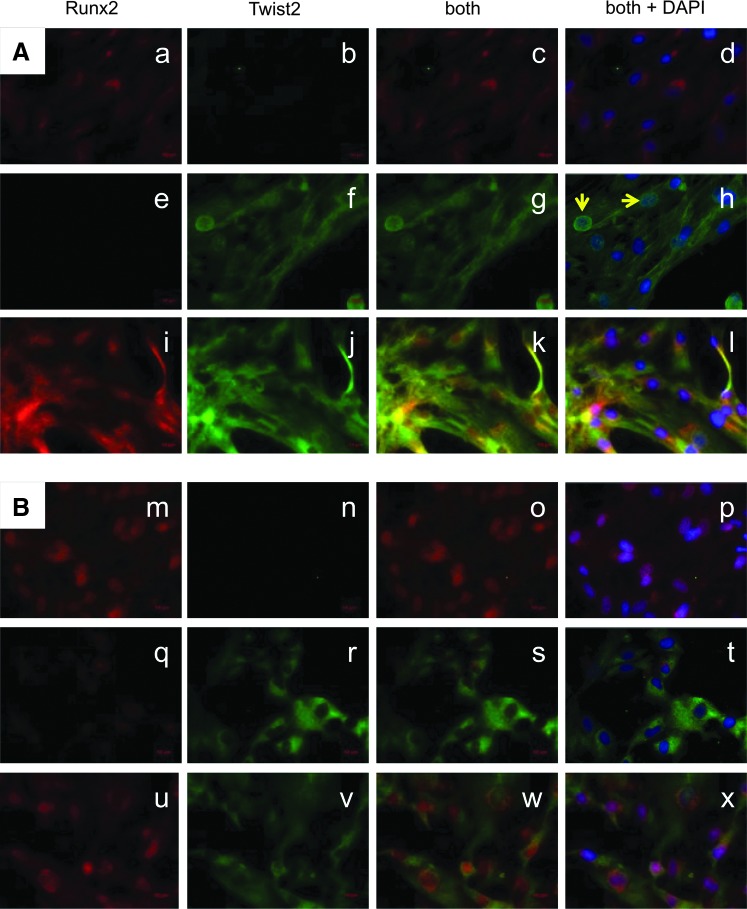
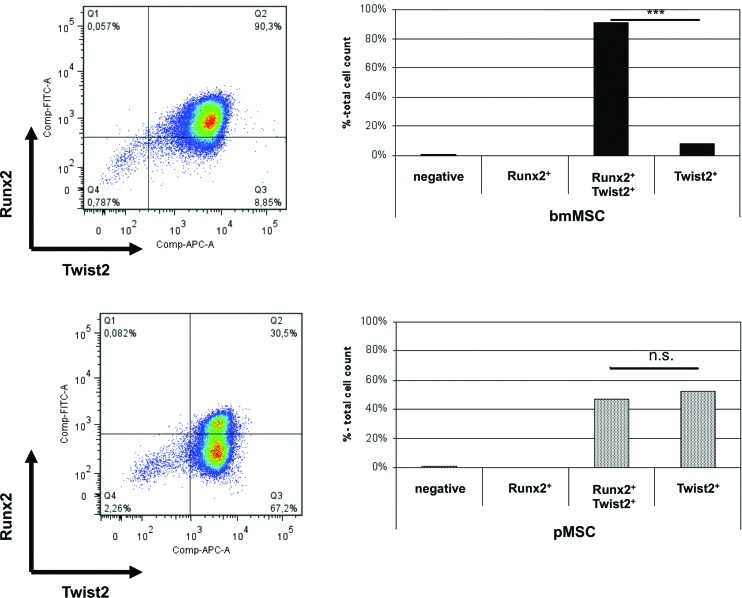
Recent studies indicated that mesenchymal stromal cells from bone marrow (bmMSC) differ in their osteogenic differentiation capacity compared to MSC from term placenta (pMSC). We extended these studies and investigated the expression of factors involved in regulation of bone metabolism in both cell types. To this end, MSC were expanded in vitro and characterized. The total transcriptome was investigated by microarrays, and for selected genes, the differences in gene expression were explored by quantitative reverse transcriptase-polymerase chain reaction, immunocytochemistry, and flow cytometry. We report that bmMSC and pMSC share expression of typical lineage surface markers, including CD73, CD90, CD105, and lack of CD14, CD34, and CD45. However, according to transcriptome analyses, they differ significantly in their expression of more than 590 genes. Factors involved in bone metabolism, including alkaline phosphatase (P<0.05), osteoglycin (P<0.05), osteomodulin (P<0.05), runt-related transcription factor 2 (Runx2) (P<0.04), and WISP2 (P<0.05), were expressed at significantly lower levels in pMSC, but twist-related protein 2 (Twist2) (P<0.0002) was expressed at significantly higher levels. The osteogenic differentiation capacity of pMSC was very low. The adipogenic differentiation was somewhat more prominent in bmMSC, while the chondrogenic differentiation seemed not to differ between bmMSC and pMSC, as determined by histochemical staining. However, expression and induction of peroxisome proliferator-activated receptor gamma-2 (PPARγ2) and Sox9, factors involved in early adipogenesis and chondrogenesis, respectively, were higher in bmMSC. We conclude that despite many similarities between bmMSC and pMSC, when expanded under identical conditions, they vary considerably with respect to their in vitro differentiation potential. For regenerative purposes, the choice of MSC may therefore influence the outcome of a treatment considerably.


Figures

FIG. 1.
FIG. 1.
Expression of cell surface proteins on mesenchymal stromal cells (MSC). The bone marrow-derived mesenchymal stromal cells (bmMSC) (A) and placenta-derived mesenchymal stromal cells (pMSC) (B) were expanded in vitro and the expression of cell surface proteins was investigated by flow cytometry. According to consensus criteria, bmMSC and pMSC lack expression of CD14, CD34, CD45 (A[a–c], B[g–i]), but must express CD73, CD90, and CD105 (A[d–f], B[j–l]) [1,2].
FIG. 2.
FIG. 2.
Differentiation of bmMSC and pMSC in vitro. Before differentiation, the bmMSC (A[a]) and pMSC (B[g]) display a fibroblastic cell shape. The differentiation was induced in bmMSC (line A′) and pMSC (line B′) for 4 weeks in vitro and progress of chondrogenic, adipogenic, and osteogenic differentiation was explored by cytochemistry. Chondrogenic differentiation was detected by Alcian Blue (b, h). Adipogenic differentiation was detected by Oil Red O staining (d, j), and osteogenic differentiation by von Kossa staining (f, l). The corresponding controls were also stained with the suitable staining solutions, respectively (c, e, i, k). In contrast to bmMSC, efficient osteogenic differentiation could not be induced in pMSC [compare (f) vs. (l)]. The bars extend 250 μm. (C) To investigate differences in gene expression following differentiation, quantitative reverse transcriptase-polymerase chain reaction (RT-qPCR) was performed 7 days after induction of osteogenic differentiation [alkaline phosphatase (ALP) and osteocalcin], adipogenic (PPARγ2), or chondrogenic (Sox9) differentiation, respectively. MSC before differentiation served as controls. Black bars illustrate transcripts of bmMSC, and gray bars transcripts of pMSC. (C) Presents the x-fold transcript amounts of the corresponding differentiation marker gene relative to the transcripts in the MSC before differentiation as indicated (controls=1). Color images available online at www.liebertpub.com/scd
FIG. 3.
FIG. 3.
Investigation of the total transcriptome of bmMSC, placenta-derived maternal MSC (pmMSC), and placenta-derived fetal MSC (pfMSC). (A) Two independent sets of mRNA were prepared from bmMSC (four and seven donors), pmMSC (four and two donors), and pfMSC (four and four donors), reverse transcribed, labeled, and hybridized in two independent experiments to a GeneChip® (Human Genome U133 Plus 2.0 Array) representing all known human transcripts. The heatmap shows the expression of the 880 most variably expressed probe sets, representing about 600 different genes, between bmMSC, pmMSC, and pfMSC as indicated. Blue coloring indicates lower, yellow coloring indicates higher total expression. The values represent normalized absolute intensities on the log2 scale. (B) Functional annotation network from Ingenuity Pathway Analysis shows documented gene relationships among the genes in our data set. Biological findings are assigned to each gene and network based on the information in the Ingenuity Pathways Knowledge Base that was extracted from current scientific literature. Genes upregulated in bone marrow (green) or upregulated in placenta (red/pink) are colored accordingly. More intense colors represent higher gene expression. Blue lines represent relationships with Runx2, pink lines with Twist2, and black lines with all other genes. Color images available online at www.liebertpub.com/scd
FIG. 3.
FIG. 3.
Investigation of the total transcriptome of bmMSC, placenta-derived maternal MSC (pmMSC), and placenta-derived fetal MSC (pfMSC). (A) Two independent sets of mRNA were prepared from bmMSC (four and seven donors), pmMSC (four and two donors), and pfMSC (four and four donors), reverse transcribed, labeled, and hybridized in two independent experiments to a GeneChip® (Human Genome U133 Plus 2.0 Array) representing all known human transcripts. The heatmap shows the expression of the 880 most variably expressed probe sets, representing about 600 different genes, between bmMSC, pmMSC, and pfMSC as indicated. Blue coloring indicates lower, yellow coloring indicates higher total expression. The values represent normalized absolute intensities on the log2 scale. (B) Functional annotation network from Ingenuity Pathway Analysis shows documented gene relationships among the genes in our data set. Biological findings are assigned to each gene and network based on the information in the Ingenuity Pathways Knowledge Base that was extracted from current scientific literature. Genes upregulated in bone marrow (green) or upregulated in placenta (red/pink) are colored accordingly. More intense colors represent higher gene expression. Blue lines represent relationships with Runx2, pink lines with Twist2, and black lines with all other genes. Color images available online at www.liebertpub.com/scd
FIG. 4.
FIG. 4.
Expression of runt-related transcription factor 2 (Runx2) and twist-related protein 2 (Twist2) encoding transcripts in bmMSC and pMSC. The cells were expanded and expression of Runx2 (A) and Twist2 (B) was investigated before differentiation by RT-qPCR. The bmMSC express significantly more Runx2 (2.6-fold, *P<0.04) compared to pMSC, and the pMSC express significantly more Twist2 compared to bmMSC (3.9-fold, ***P<0.0002).
FIG. 5.
FIG. 5.
Detection of Runx2 and Twist2 in MSC by immunocytochemical staining. Expression and distribution of Runx2 and Twist2 proteins were investigated by immunocytochemistry/immunocytochemical in bmMSC (a–l) and pMSC (m–x) with antibodies as indicated. Nuclei were visualized by 4′,6-diamidino-2-phenylindol-dihydro-chlorid counterstaining and different areas of representative samples of MSC from three donors are shown. Expression of Runx2 (red, Cy3) is localized in and around the nuclei (d, l, p, x), whereas Twist2 [green, fluorescein isothiocyanate (FITC)] is spread all over the cytoplasm (h, t). In a few bmMSC, nuclear Twist2 was detected (h, arrows). There is no homogenous appearance of the distribution of Runx2- and/or Twist2-expressing cells across the samples. There are regions where only Runx2 (a, m) or Twist2 (f, r) is detected. In some areas, expression of both proteins is observed (k, w). Color images available online at www.liebertpub.com/scd
FIG. 6.
FIG. 6.
Detection of intracellular Runx2 and Twist2 in MSC. The bmMSC (top panels) and pMSC (bottom panels) were expanded, characterized, and an aliquot of cells was permeabilized to allow staining of intracellular antigens. The cells were washed and analyzed by flow cytometry. Here two representative examples are shown. Expression of Twist2 is presented on X-axis (APC), expression of Runx2 on the Y-axis (FITC). Ninety percent of the bmMSC express Runx2 and Twist2, and only 9% Twist2 alone (quadrant Q3; upper left panel). The mean of the relative cell count of positive bmMSC was calculated from three individual flow cytometry experiments and the difference between numbers of Runx2posTwist2pos versus Runx2posTwist2neg was significant (***P<0.001; upper right panel). The majority of pMSC expressed Twist2 (quadrants Q2, Q3; lower left panel), although with a lower signal intensity compared with bmMSC (upper panel). While 30% of the pMSC were Runx2posTwist2pos, 67% were Runx2negTwist2pos (lower left panel). The mean of the relative cell counts of pMSC was calculated from three individual flow cytometry experiments, and the difference between numbers of Runx2posTwist2pos versus Runx2negTwist2pos was not significant (n.s., lower right panel). Color images available online at www.liebertpub.com/scd

Similar articles

Cited by

References

    1. Dominici M. Le Blanc K. Mueller I. Slaper-Cortenbach I. Marini F. Krause D. Deans R. Keating A. Prockop D. Horwitz E. Minimal criteria for defining multipotent mesenchymal stromal cells. International Society for Cellular Therapy position statement. Cytotherapy. 2006;8:315–317. - PubMed
    1. Parolini O. Alviano F. Bagnara GP. Bilic G. Buhring HJ. Evangelista M. Hennerbichler S. Liu B. Magatti M, et al. Concise review: isolation and characterization of cells from human term placenta: outcome of the first International Workshop on Placenta Derived Stem Cells. Stem Cells. 2008;26:300–311. - PubMed
    1. Tormin A. Li O. Brune JC. Walsh S. Schüz B. Ehinger M. Ditzel N. Kassem M. Scheding S. CD146 expression on primary nonhematopoietic bone marrow stem cells is correlated with in situ localization. Blood. 2011;117:5067–5077. - PMC - PubMed
    1. Chamberlain G. Fox J. Ashton B. Middleton J. Concise review: mesenchymal stem cells: their phenotype, differentiation capacity, immunological features, and potential for homing. Stem Cells. 2007;25:2739–2749. - PubMed
    1. Kolf CM. Cho E. Tuan RS. Mesenchymal stromal cells. Biology of adult mesenchymal stem cells: regulation of niche, self-renewal and differentiation. Arthritis Res Ther. 2007;9:204. - PMC - PubMed

Publication types

MeSH terms