. 2013 Aug 5;10(8):3175-85.
doi: 10.1021/mp400222j. Epub 2013 Jul 8.

In vivo and in silico pharmacokinetics and biodistribution of a melanocortin receptor 1 targeted agent in preclinical models of melanoma

Affiliations

In vivo and in silico pharmacokinetics and biodistribution of a melanocortin receptor 1 targeted agent in preclinical models of melanoma

Narges K Tafreshi et al. Mol Pharm. .

Abstract

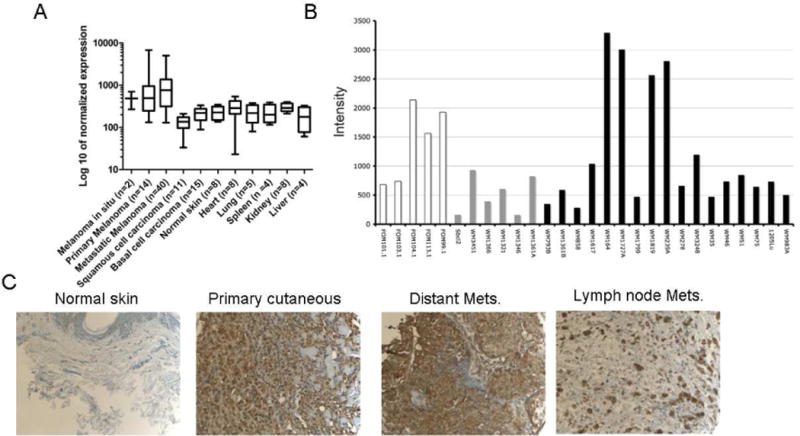
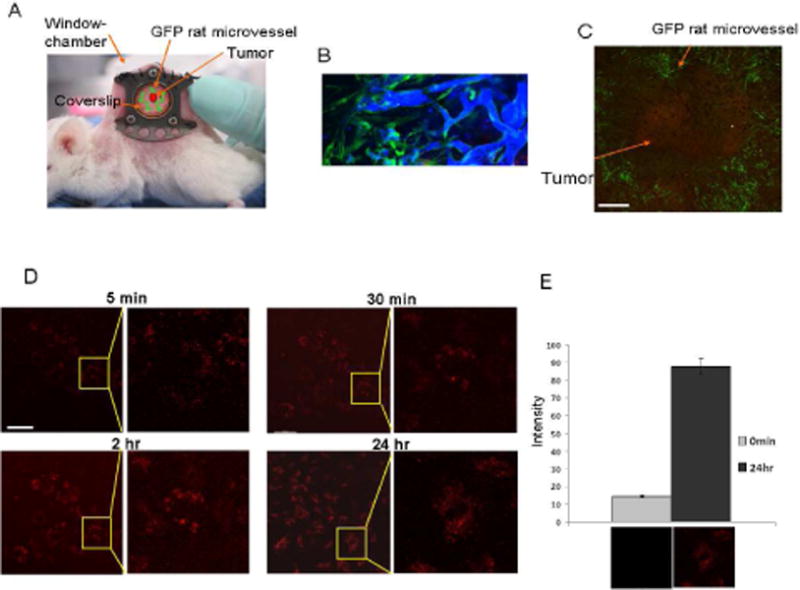
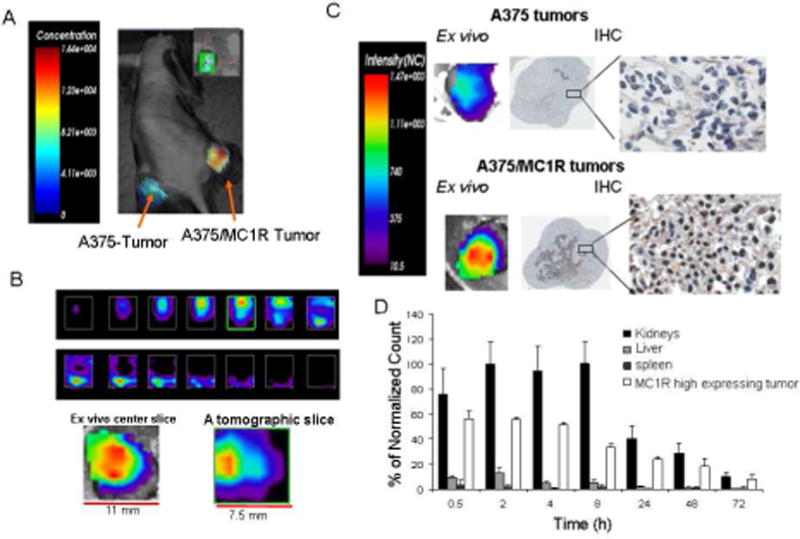
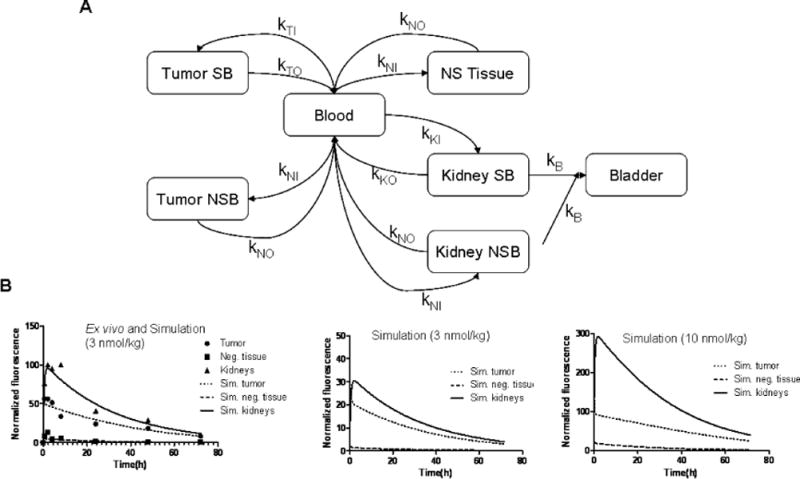
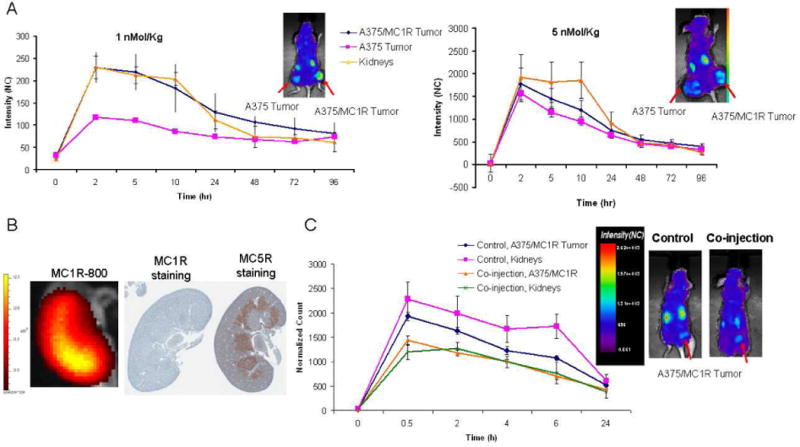
The melanocortin 1 receptor (MC1R) is overexpressed in most melanoma metastases, making it a promising target for imaging of melanomas. In this study, the expression of MC1R in a large fraction of patients with melanoma was confirmed using mRNA and tissue microarray. Here, we have characterized the in vivo tumor and tissue distribution and pharmacokinetics (PK) of uptake and clearance of a MC1R specific peptidomimetic ligand conjugated to a near-infrared fluorescent dye. We propose an interdisciplinary framework to bridge the different time and space scales of ligand-tumor-host interactions: intravital fluorescence microscopy to quantify probe internalization at the cellular level, a xenograft tumor model for whole body pharmacokinetics, and a computational pharmacokinetic model for integration and interpretation of experimental data. Administration of the probe into mice bearing tumors with high and low MC1R expression demonstrated normalized image intensities that correlated with expression levels (p < 0.05). The biodistribution study showed high kidney uptake as early as 30 min postinjection. The PK computational model predicted the presence of receptors in the kidneys with a lower affinity, but at higher numbers than in the tumors. As the mouse kidney is known to express the MC5R, this hypothesis was confirmed by both coinjection of a ligand with higher MC5R affinity compared to MC1R and by injection of lower probe concentrations (e.g., 1 nmol/kg), both leading to decreased kidney accumulation of the MC1R ligand. In addition, through this interdisciplinary approach we could predict the rates of ligand accumulation and clearance into and from organs and tumors, and the amount of injected ligand required to have maximum specific retention in tumors. These predictions have potential to aid in the translation of a targeted agent from lab to the clinic. In conclusion, the characterized MC1R-specific probe has excellent potential for in vivo detection of melanoma metastases. The process of cell-surface marker validation, targeted imaging probe development, and in vitro, in vivo, and in silico characterization described in this study can be generally applied to preclinical development of targeted agents.


Figures

Figure 1
Figure 1
A) DNA microarray expression profile of MC1R in melanoma, other skin cancers and normal tissues. Data are represented as mean ± SD. Note the log10 scale. B) DNA microarray of primary human melanocytes (white), melanoma cell lines with the NRAS mutation (gray) and melanoma cell lines with the BRAF mutation (black). C) Representative IHC staining of MC1R in normal skin with a pathology score of 3 and different types of melanoma with pathology score of ≥4.
Figure 2
Figure 2
In vivo uptake studies of the MC1RL-Cy5 probe using the dorsal skin-fold window chamber xenograft tumor model for intravital confocal imaging. A) Mouse bearing a dorsal skin-fold window-chamber. B) Verification of GFP rat microvessel (green) patency following intravenous injection of Blue Dextran using confocal fluorescence microscopy. C) Intravital confocal microscope image of probe (red) labeling tumor cells 24 h after administration and green microvessels using 4X magnification. Bar = 1000μm. D) At 25X magnification (left panel for each time-point), probe fluorescence was detected on the cell surface by 5 min after i.v. injection of the probe, and was detected inside the cells by 24 h after injection. A close-up image (right panel for each time-point) is shown to better illustrate cell binding and uptake. Bar = 100μm. E) Quantification of the probe-related fluorescence signal before injection and at 24 hr after injection (P=0.025). Representative images are underneath each graph.
Figure 3
Figure 3
In vivo and ex vivo uptake of MC1RL-800 into tumor. A) Representative time-domain based fluorescence tomography image of MC1RL-800 accumulation in mouse xenograft tumors 2 hours after intravenous injection of 5 nmol/kg probe. A375 cells that constitutively express low levels of MC1R were used to form the low-expressing tumor (left flank) and A375/MC1R cells were used to form the high expressing tumor (right flank). Only the tumor areas were scanned. B) Top: In vivo tomographic slices (0.5 mm thickness) through the high-expression tumor from top to bottom (ordered from left to right). Below: Ex vivo surface radiance image of a center section from the high-expressing tumor (left) compared to the center slice from the in vivo tomographic image of the same tumor. An effort was made to maintain registration of the ex vivo section with the in vivo image slice. All analyses were performed using the Optix-MX3 Optiview Software (version 3.01). C) Ex vivo images of center sections from low- and high-expressing tumors with corresponding IHC staining of MC1R. D) Biodistribution of MC1RL-800 probe determined by quantification of ex vivo fluorescence values from the tumor, kidneys and liver at different time-points post-injection of 3 nmol/kg probe. No signal was detected in the heart, lung, brain and other organs (not shown). The values were normalized as percentage of the highest signal.
Figure 4
Figure 4
Mathematical modeling of MC1RL-800 uptake in the body. A) Graphical representation of the multi-compartment model used in this study. The targeted probe injected into the blood stream diffuses to all tissues in the mouse (NS Tissue), preferentially accumulating in the positive tumor in a specific and non-specific manner (Tumor SB and Tumor NSB). Targeted probe also accumulates in the kidney in a specific and non-specific way (Kidney SB and Kidney NSB), and is filtered into the bladder. B) Multi-compartmental model simulations of the pharmacokinetic distribution of probe over time at a range of dosages. On the left, the ex vivo imaging data for an injection of 3 nmol/kg were used to determine the model parameters with the best fit, the simulation (lines) overlay the data (points). In the middle and right are simulations of lower 1 nmol/kg and higher (10 nmol/kg) injected doses, respectively.
Figure 5
Figure 5
In vivo pharmacokinetics study of MC1RL-800. A) Plots of normalized fluorescence values for high- and low-expressing tumors and kidneys over a longitudinal time-course following administration of low (1 nmol/kg) and high (5 nmol/kg) doses of probe. Insets show representative normalized fluorescence intensity map overlays on visible light images of mice bearing bilateral flank xenograft tumors, 2 hours post intravenous injection of the probe that were acquired using the Optix-MX-3 instrument. B) A representative ex vivo fluorescence image (left) of kidney 2 hr after probe injection acquired using the IVIS 200 instrument and corresponding IHC stained sections of MC1R (center) and MC5R (right). C) Co-injection of 1 nmol/kg of MC5R specific ligand and 5 nmol/kg of MC1RL-800 (right image) to reduce kidney uptake of the probe. Inset shows representative normalized fluorescence intensity map overlays, 30 min post intravenous injection of the probe (control, left image) and probe plus MC5R ligand co-injection (right image). Images were acquired using the Optix-MX-3 instrument. Data represent mean ± s.d. NC: Normalized Counts.

References

    1. Siegel R, Naishadham D, Jemal A. Cancer statistics, 2012. CA Cancer J Clin. 2012;62:10–29. - PubMed
    1. Thompson JF, Uren RF. Lymphatic mapping in management of patients with primary cutaneous melanoma. Lancet Oncol. 2005;6:877–85. - PubMed
    1. Leung AM, Hari DM, Morton DL. Surgery for distant melanoma metastasis. Cancer J. 2012;18:176–84. - PMC - PubMed
    1. Wong SL, Balch CM, Hurley P, Agarwala SS, Akhurst TJ, Cochran A, Cormier JN, Gorman M, Kim TY, McMasters KM, Noyes RD, Schuchter LM, Valsecchi ME, Weaver DL, Lyman GH. Sentinel Lymph Node Biopsy for Melanoma: American Society of Clinical Oncology and Society of Surgical Oncology Joint Clinical Practice Guideline. J Clin Oncol. 2012 - PMC - PubMed
    1. Caudle AS, Ross MI. Metastasectomy for stage IV melanoma: for whom how much? Surg Oncol Clin N Am. 2011;20:133–44. - PubMed

Publication types

Substances