. 2013 Jun 10;23(6):753-67.
doi: 10.1016/j.ccr.2013.04.026.

PDEF promotes luminal differentiation and acts as a survival factor for ER-positive breast cancer cells

Affiliations

PDEF promotes luminal differentiation and acts as a survival factor for ER-positive breast cancer cells

Gilles Buchwalter et al. Cancer Cell. .

Abstract

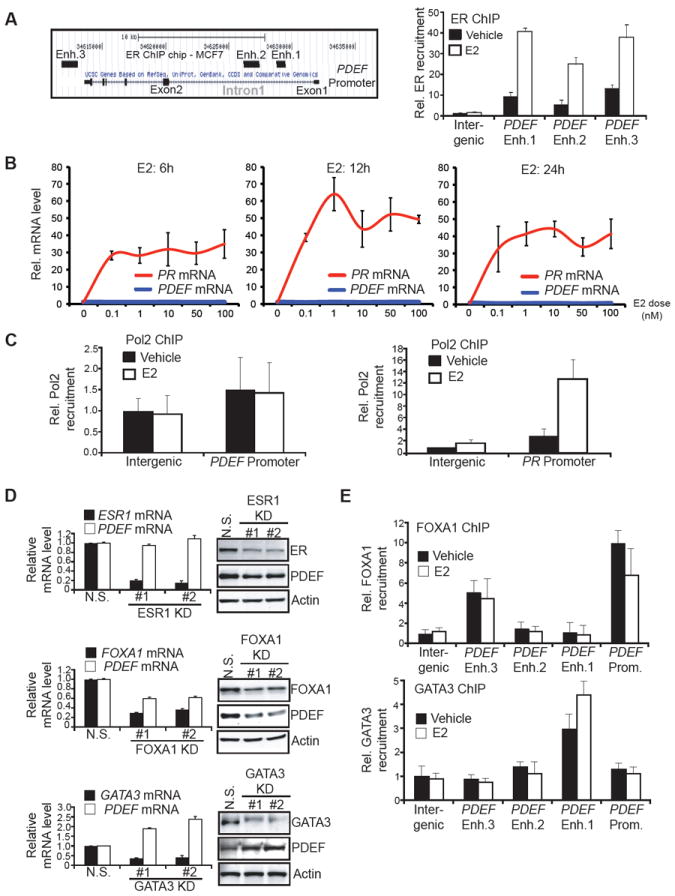
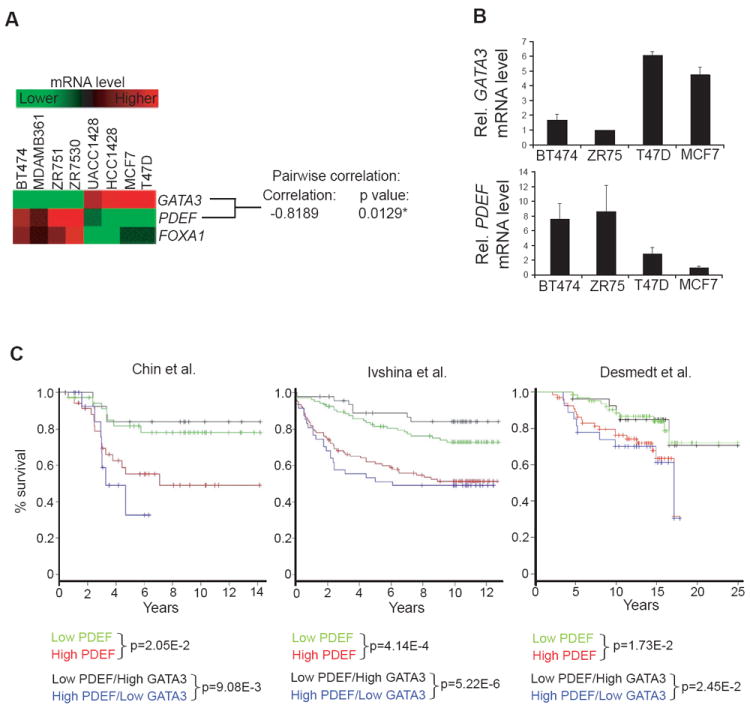
Breast cancer is a heterogeneous disease and can be classified based on gene expression profiles that reflect distinct epithelial subtypes. We identify prostate-derived ETS factor (PDEF) as a mediator of mammary luminal epithelial lineage-specific gene expression and as a factor required for tumorigenesis in a subset of breast cancers. PDEF levels strongly correlate with estrogen receptor (ER)-positive luminal breast cancer, and PDEF transcription is inversely regulated by ER and GATA3. Furthermore, PDEF is essential for luminal breast cancer cell survival and is required in models of endocrine resistance. These results offer insights into the function of this ETS factor that are clinically relevant and may be of therapeutic value for patients with breast cancer treated with endocrine therapy.


Figures

Figure 1
Figure 1. PDEF Induces a Luminal Lineage-specific Gene Expression Profile in Non-Transformed Mammary Epithelial Cells
(A) Heatmap generated from microarray analysis of triplicate samples of MCF-10A cells expressing either vector control (pBabe) or PDEF. Differentially expressed mammary epithelial marker genes are shown. These expression changes were statistically significant (p=4.14 × 10⁻¹⁴ by Fisher’s exact test). (B) Western blot analysis of vector control or PDEF-expressing MCF-10A cells (*non-specific band). (C) Immunofluorescent staining for keratins 8 and 14 in MCF-10A cells. Representative images of vector control and PDEF-expressing cells are shown. Scale bars represent 100μM. Quantitation is shown in graph. Data represent mean +/- SEM (***p< 0.0007). (D) Western blot confirming PDEF overexpression in human mammary epithelial cells (HMECs). (E) Real-time PCR analysis of luminal (left) and basal (right) marker gene expression in HMECs overexpressing PDEF. Results were normalized to the housekeeping gene RPLP0 and are presented as mean fold change +/- SD (*p< 0.05, **p<0.008). (F) Flow cytometry surface marker analysis of HMECs using antibodies for the luminal gene EpCAM and the myoepithelial gene CD10. A representative experiment is shown; similar results were obtained in two independent experiments. (G) PDEF overexpression in COMMA-1D murine mammary epithelial cells was detected by western blot (top). PDEF downregulation was detected by real-time PCR (bottom); two independent shRNAs (PDEF KD: KnockDown #1 and #2) were used and compared to a non-specific (N.S.) shRNA control. Results were normalized to the housekeeping gene RPLP0 and are presented as mean fold change +/- SEM (*p< 0.02, ***p<0.0005). (H) COMMA-1D cells infected with lentivirus to modulate PDEF expression were plated on a layer of irradiated fibroblast feeder cells for colony formation assays. Colonies were scored based on K8 (red) and K14 (green) staining and categorized into three types of colonies: K8+ luminal, K14+ myoepithelial, or K8+K14+ mixed colonies. Representative images of each type of colony are shown (left), scale bars represent 100μM. Quantitation of PDEF-overexpressing cells (middle panel, +/- SEM) and PDEF-downregulated cells (right panel, +/- SD) are shown as the average fold change in colony number across three experiments compared to vector or N.S. control cells (*p<0.05, **p<0.006, ***p<0.0001). (I) Box plot displaying PDEF mRNA levels in mammary stem cells (MaSC), luminal progenitors, mature luminal cells, and stromal cells derived from gene expression analysis of purified human mammary epithelial subpopulations (Lim et al., 2009). (J) Relative mRNA expression levels of luminal (left panel) and myoepithelial (right panel) markers in luminal progenitor cells transduced with PDEF-targeting shRNA (KD) or N.S. shRNA. Cells were harvested 5 days after infection. Bars represent fold change +/- SD of two independent experiments (*p<0.05, **p<0.01, ***p<0.001). See also Figure S1 and Table S1.
Figure 2
Figure 2. PDEF Is Enriched in Luminal Tumors and Strongly Correlates with ER Expression
(A, B) Box plots displaying PDEF mRNA levels between Basal-like, ERBB2+, and Luminal (Lum) subtypes of breast cancer (A) and breast cancer cell lines (B) using published microarray datasets (Lu et al., 2008; Perou et al., 2000; Neve et al., 2006). (C) Box plots displaying PDEF mRNA levels between ER- and ER+ breast carcinoma (F.C.: Fold change) in published microarray datasets (Chin et al., 2006; Richardson et al., 2006; Wang et al., 2005). (D) Heatmap displaying the relative expression levels of the 28 ETS transcription factors in ER- and ER+ breast cancer subtypes (Wang et al., 2005; Richardson et al., 2006; Chin et al., 2006) (N.D. not determined).
Figure 3
Figure 3. PDEF Is Not Directly Regulated by ER, But Is Activated by FOXA1 and Repressed by GATA3
(A) Left panel: Schematic diagram of the ER-binding regions within the PDEF gene locus as defined by ER ChIP on chip in MCF7 cells (Carroll et al., 2006). Enh.: Enhancer. Right panel: Direct ER chromatin immunoprecipitation (ChIP) followed by qPCR after treatment of MCF7 cells with vehicle (black bars) or 10nM estradiol (E2, white bars). Data represent means +/- SD. (B) PDEF and PR mRNA levels were determined by real-time PCR after MCF7 cells were treated with increasing E2 doses for 6h (left), 12h (middle), and 24h (right). mRNA levels are presented as means with SD and normalized to the housekeeping gene GAPDH. (C) Direct RNA polymerase II (Pol2) ChIP followed by qPCR after treatment of MCF7 cells with vehicle or 10nM E2 using primers flanking the PDEF promoter (left panel) and PR promoter (right panel). Data represent means with SD. (D) PDEF, ESR1, FOXA1, GATA3 mRNA and protein levels were determined by RT-qPCR (left panels) or western blot (right panels) after MCF7 cells were transfected with a non-specific (N.S.) or two independent siRNAs targeting ESR1/FOXA1/GATA3(KD: KnockDown). Data represent means with SD. (E) Direct FOXA1 (Upper panel) and GATA3 (lower panel) ChIPs followed by qPCR after treatment of MCF7 cells with vehicle or 10nM E2. Enh.: Enhancer. Prom.: Promoter. Data represent means with SD. See also Figure S2.
Figure 4
Figure 4. GATA3 Prevents PDEF Induction by ER
(A) GATA3 (upper panel) and PDEF (lower panel) mRNA levels were determined by RT-qPCR after MCF7 cells were transfected with a non-specific (N.S.) or GATA3-targeting (KD: KnockDown) siRNAs and challenged with 10nM estradiol (E2). Data represent means with SD. (B) Western blots lysates from MCF7 cells transfected with N.S. or GATA3-targeting (KD) siRNAs, and challenged with 10nM estradiol. (C) Direct RNA polymerase II (Pol2), ER, p300, acetylated histone H3K18 and H4K12 ChIPs followed by real-time PCR after MCF7 cells were transfected with N.S. or GATA3-targeting (KD) siRNAs, and challenged with 10nM E2. Data represent means with SD. Enh.: Enhancer. See also Figure S3.
Figure 5
Figure 5. PDEF and GATA3 Are Inversely Correlated in ER+ Luminal Tumor Cell Lines and their Expression Levels are of Prognostic Value for ER+ Breast Carcinoma Patient Survival
(A) Heatmap displaying GATA3, PDEF, FOXA1 mRNA levels in eight ER+ breast cancer cell lines (Neve et al., 2006) with pairwise correlation analysis (Scale: +1: perfect positive correlation, 0: no correlation, −1: perfect inverse correlation). (B) GATA3 (upper panel) and PDEF (lower panel) mRNA levels were determined by real-time PCR in four ER+ breast cancer cell lines. Data represent means with SD. (C) Kaplan-Meier survival analysis of ER+ breast carcinoma patients (Chin et al., 2006; Ivshina et al., 2006; Desmedt et al., 2007). Patients were stratified on the median value for each marker. The log-rank test p values are shown.
Figure 6
Figure 6. PDEF Knockdown Sensitizes MCF7 Cells to Hormone-Related Stress and Decreases their Tumorigenic Properties
(A) PDEF mRNA levels were determined by real-time PCR in MCF7 cells transfected with non-specific (N.S) or two independent PDEF-targeting (PDEF KD: KnockDown) siRNAs, and then grown for 3 days in hormone-depleted medium with 10nM E2. Data represent means with SD. (B) Growth curves of MCF7 cells transfected with N.S. or PDEF-targeting (KD) siRNAs in hormone depleted medium with 10nM E2. Data represent means with SD. (C) AnnexinV/Propidium Iodide cell viability measurement of MCF7 cells transfected with N.S. or PDEF-targeting (KD) siRNAs, then grown for 24h in hormone-depleted medium. Data represent means with SD. (D) Measurement of cytotoxicity after transfection of MCF7 cells with N.S. or PDEF-targeting (KD) siRNAs, followed by treatment for 48h with increasing doses of tamoxifen (left panel) or fulvestrant (right panel). Data represent means with SD. (E) Soft agar colony formation assay of MCF7 cells infected with N.S. or PDEF-targeting (KD) shRNAs. The average fold change +/- SEM in colony number compared to control N.S. cells across three independent experiments is shown (*p<0.02, ***p<0.0001). (F) Measurement of MCF7 xenograft tumor weight. Mammary fat pads of NOD/SCID mice were injected with N.S. or PDEF-targeting shRNA (KD #1 and #2) MCF7 cells. Estradiol release pellets were implanted subcutaneously 2-3 days prior to surgery. Tumors were harvested and weighed after eight weeks of growth. Data represent mean +/- SEM, *p<0.04. Tumor sections were subjected to histological analysis by hematoxylin and eosin staining (H&E). Scale bars represent 50μM. (G) Western blots of MCF7 xenograft tumor lysates. Tumors expressing either N.S. or PDEF-targeting (KD) shRNAs were analyzed. (H) Tumor sections were subjected to TUNEL cell death staining (red). Nuclei were stained with DAPI (blue). Three different tumors were stained for each shRNA (N.S., PDEF KD#1 and #2) and 5 fields were photographed for each section. Representative images for each tumor type are shown. Scale bars represent 20μM. The ratio of TUNEL signal to the total number of nuclei is shown in the histogram. Data represent means with SD. (***p<0.001). See also Figure S4.
Figure 7
Figure 7. PDEF Expression Is Increased in Long Term Estrogen-Deprived Cells and Tamoxifen-Resistant (TAM-R) Cells Derived from MCF7 Cells
(A, B) PDEF and GATA3 mRNA and protein levels were determined by real-time PCR (A) or western blot (B) in parental MCF7 cells (WS8), clones 2A and 5C (upper panels), and tamoxifen-resistant (TAM-R) cells (lower panels). mRNA levels are presented as means with SD and normalized to the housekeeping gene GAPDH. (C) Left panel: PDEF mRNA levels were determined in MCF7 5C cells by real-time PCR after transfection of non-specific (N.S.) or PDEF-targeting (PDEF KD: KnockDown) siRNAs. Middle panel: Measurement of MCF7 5C cell mortality (**p<0.005, data represent mean+/-SD). Right Panel: Soft agar colony formation assay of MCF7 5C cells infected with non-specific (N.S) or PDEF-targeting (KD) shRNAs. Data represent the average fold change +/- SEM in colony number compared to control N.S. cells, *p<0.02. (D) Left panel: PDEF mRNA levels were determined in MCF7 TAM-R cells by real-time PCR seven days after transduction of N.S. or PDEF-targeting (KD) shRNAs in the presence of 10-7M tamoxifen or vehicle (EtOH). Right panel: Soft agar colony formation assay of MCF7 TAM-R cells infected with N.S. control shRNA or PDEF-targeting shRNA (KD) in the presence of 10-7M tamoxifen or vehicle (EtOH) (***p<0.001, *p<0.05). Data represent means +/- SD.
Figure 8
Figure 8. PDEF Promotes a Pro-Survival Gene Expression Program in Hormone-Depleted Conditions and Represses Pro-Apoptotic Death Domain FAS Receptor Expression
(A) Heatmap of a selection of differentially expressed genes generated from microarray analysis of MCF7 cells infected with non-specific (N.S.) or PDEF-targeting (PDEF KD: KnockDown) shRNAs, then subjected to hormone depletion for 48h. These expression changes were statistically significant. (B) Kaplan-Meier survival analysis of the relationship between survival time and the PDEF signature. The PDEF signature was trained and tested on the Ivshina data set (Ivshina et al., 2006). The log-rank p-value is an indicator of significant differences in patient outcome when patients are dichotomized at the median of the predictor. The Cox p value treats the predictor as a continuous variable. (C, D) PDEF and FAS mRNA and protein levels were determined by real-time PCR (C) or western blot (D) in MCF7 cells infected with N.S. or PDEF-targeting (KD) shRNAs, and grown for 48h (C) or 72h (D) in hormone-depleted medium. mRNA levels are presented as means with SD and normalized to the housekeeping gene GAPDH. (E) Upper panel: Schematic diagram of the PDEF binding region (indicated by arrow) upstream of the FAS gene locus as defined by PDEF ChIP sequencing in VCaP cells (Wei et al., 2010). Lower panel: Direct PDEF ChIP followed by qPCR after culture of MCF7 cells in hormone-depleted medium for 48 hours. Data represent means with SD. (F) Measurement of caspase 8 activity in MCF7 cells transfected with N.S. or PDEF-targeting (KD) siRNAs, then subjected to hormone depletion (48h) in the presence of a negative control antibody or anti-Fas Ligand antibody (FasL, 5ng/mL). Data represent means with SD. (G, H) PDEF and FAS mRNA and protein levels were determined by real-time PCR (G) or western blot (H) in MCF7 2A and 5C clones infected with N.S. or PDEF-targeting (KD) shRNAs. mRNA levels are presented as means with SD and normalized to the housekeeping gene GAPDH. (I) PDEF belongs to a network of ER-associated factors, and is positively regulated by ER and FOXA1, whereas GATA3 acts as a repressor of PDEF expression. (J) Mechanism of GATA3-mediated repression of PDEF. (K) Physiological and pathological functions of PDEF. See also Figure S5 and Tables S2, S3.

References

    1. Allinen M, Beroukhim R, Cai L, Brennan C, Lahti-Domenici J, Huang H, Porter D, Hu M, Chin L, Richardson A, et al. Molecular characterization of the tumor microenvironment in breast cancer. Cancer cell. 2004;6:17–32. - PubMed
    1. Ariazi EA, Cunliffe HE, Lewis-Wambi JS, Slifker MJ, Willis AL, Ramos P, Tapia C, Kim HR, Yerrum S, Sharma CG, et al. Estrogen induces apoptosis in estrogen deprivation-resistant breast cancer through stress responses as identified by global gene expression across time. Proceedings of the National Academy of Sciences of the United States of America. 2011;108:18879–18886. - PMC - PubMed
    1. Asselin-Labat ML, Sutherland KD, Barker H, Thomas R, Shackleton M, Forrest NC, Hartley L, Robb L, Grosveld FG, van der Wees J, et al. Gata-3 is an essential regulator of mammary-gland morphogenesis and luminal-cell differentiation. Nature cell biology. 2007;9:201–209. - PubMed
    1. Carroll JS, Meyer CA, Song J, Li W, Geistlinger TR, Eeckhoute J, Brodsky AS, Keeton EK, Fertuck KC, Hall GF, et al. Genome-wide analysis of estrogen receptor binding sites. Nature genetics. 2006;38:1289–1297. - PubMed
    1. Chin K, DeVries S, Fridlyand J, Spellman PT, Roydasgupta R, Kuo WL, Lapuk A, Neve RM, Qian Z, Ryder T, et al. Genomic and transcriptional aberrations linked to breast cancer pathophysiologies. Cancer cell. 2006;10:529–541. - PubMed

Publication types

MeSH terms

Associated data