. 2013 Jun 13:13:285.
doi: 10.1186/1471-2407-13-285.

Mitochondria-targeted vitamin E analogs inhibit breast cancer cell energy metabolism and promote cell death

Affiliations

Mitochondria-targeted vitamin E analogs inhibit breast cancer cell energy metabolism and promote cell death

Gang Cheng et al. BMC Cancer. .

Abstract

Background: Recent research has revealed that targeting mitochondrial bioenergetic metabolism is a promising chemotherapeutic strategy. Key to successful implementation of this chemotherapeutic strategy is the use of new and improved mitochondria-targeted cationic agents that selectively inhibit energy metabolism in breast cancer cells, while exerting little or no long-term cytotoxic effect in normal cells.

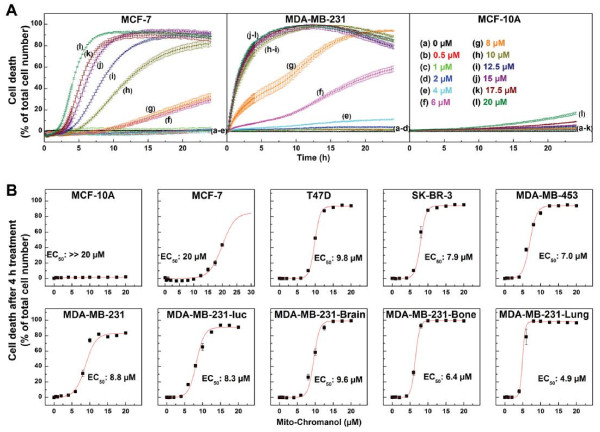
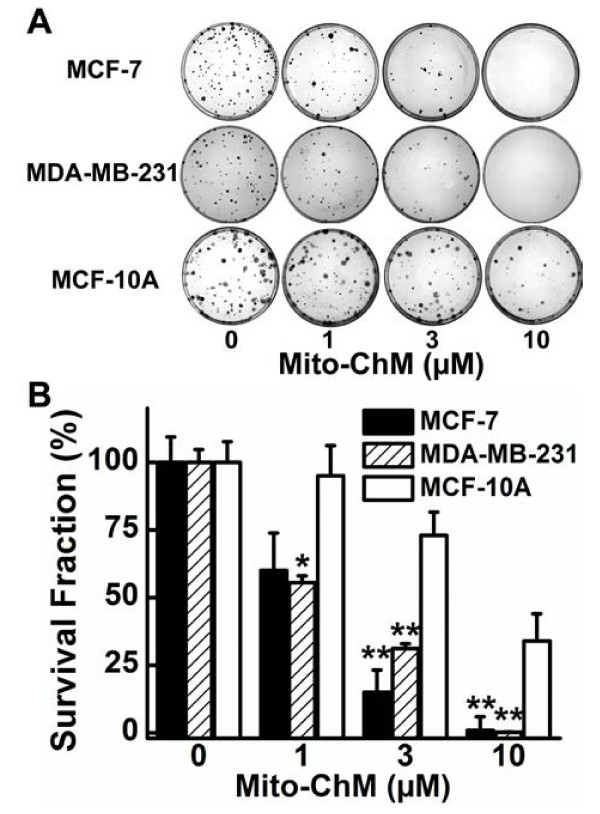
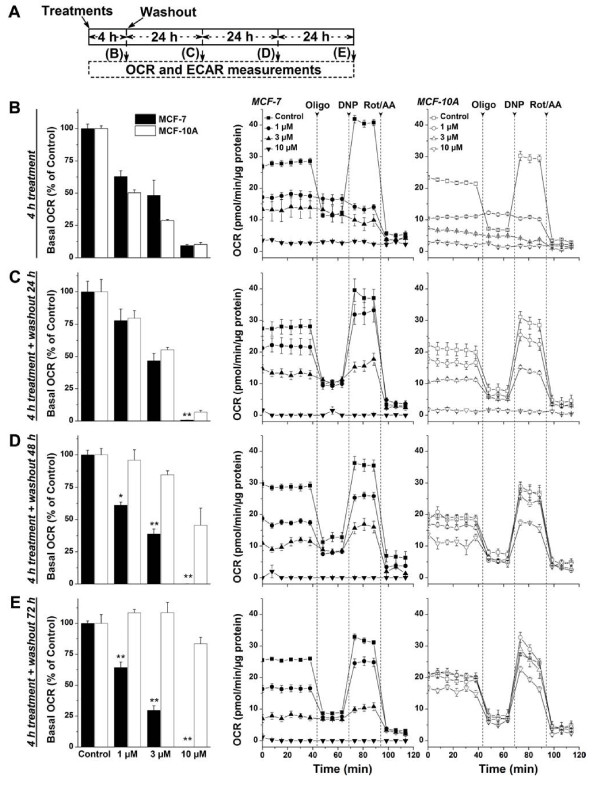
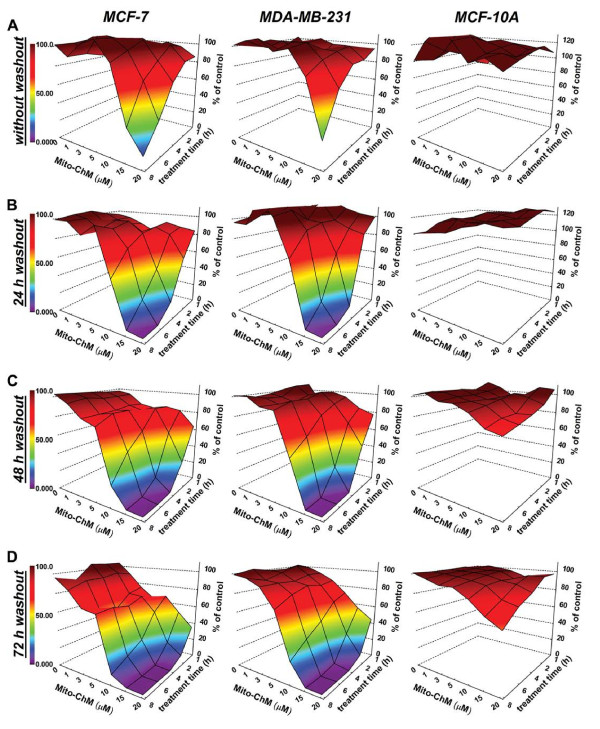
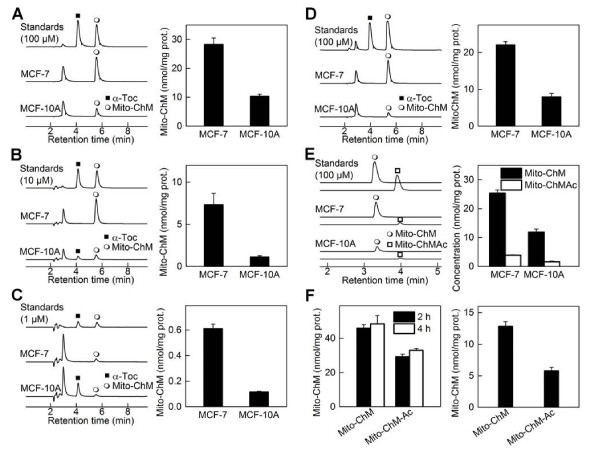
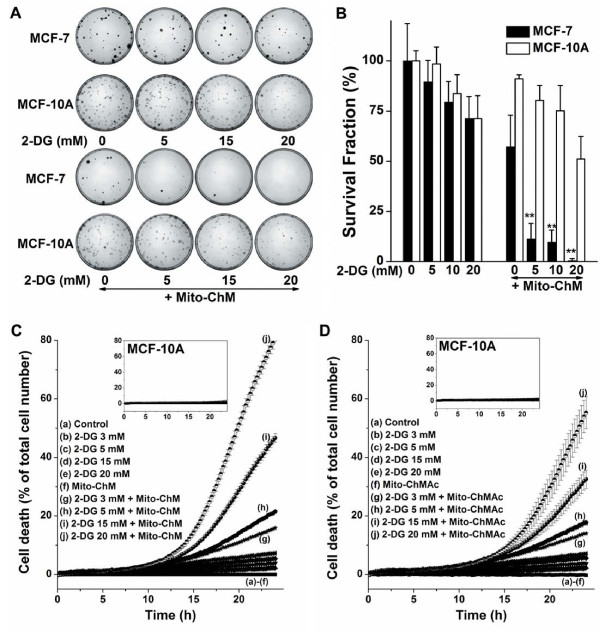
Methods: In this study, we investigated the cytotoxicity and alterations in bioenergetic metabolism induced by mitochondria-targeted vitamin E analog (Mito-chromanol, Mito-ChM) and its acetylated ester analog (Mito-ChMAc). Assays of cell death, colony formation, mitochondrial bioenergetic function, intracellular ATP levels, intracellular and tissue concentrations of tested compounds, and in vivo tumor growth were performed.

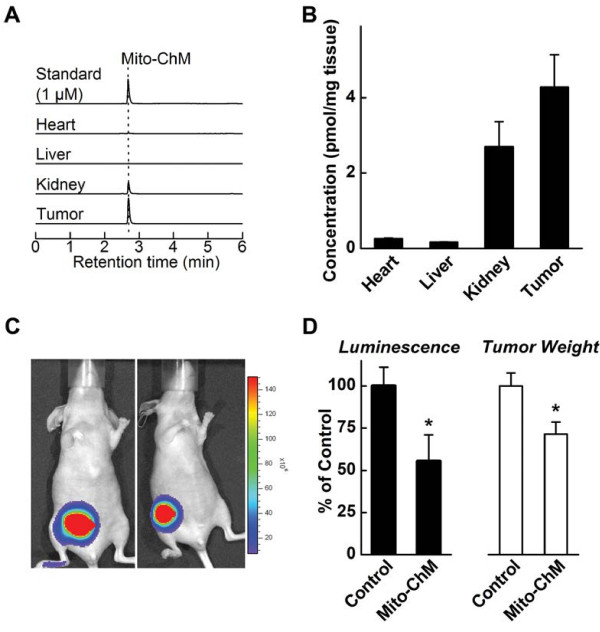
Results: Both Mito-ChM and Mito-ChMAc selectively depleted intracellular ATP and caused prolonged inhibition of ATP-linked oxygen consumption rate in breast cancer cells, but not in non-cancerous cells. These effects were significantly augmented by inhibition of glycolysis. Mito-ChM and Mito-ChMAc exhibited anti-proliferative effects and cytotoxicity in several breast cancer cells with different genetic background. Furthermore, Mito-ChM selectively accumulated in tumor tissue and inhibited tumor growth in a xenograft model of human breast cancer.

Conclusions: We conclude that mitochondria-targeted small molecular weight chromanols exhibit selective anti-proliferative effects and cytotoxicity in multiple breast cancer cells, and that esterification of the hydroxyl group in mito-chromanols is not a critical requirement for its anti-proliferative and cytotoxic effect.


Figures

Figure 1
Figure 1
The cytotoxic effect of Mito-ChM in breast cancer and non-cancerous cells. Nine different breast cancer cells and MCF-10A cells were treated with Mito-ChM at the indicated concentrations (0.5-20 μM) for 24 h, and cell death was monitored in real time by Sytox Green staining. Data shown are the means ± SEM for n = 4. Real time cell death curves were plotted in panel A for MCF-7 (left), MDA-MB-231 (middle) and MCF-10A cells (right). Panel B shows the titration of breast cancer and non-cancerous cells with Mito-ChM, and the extent of cell death observed after 4 h treatment is plotted against Mito-ChM concentration. Solid lines represent the fitting curves used for determination of the EC50 values, indicated in each panel.
Figure 2
Figure 2
Effects of Mito-ChM on colony formation in MCF-7, MDA-MB-231 and MCF-10A cells. (A) MCF-7, MDA-MB-231 and MCF-10A cells were treated with Mito-ChM (1–10 μM) for 4 h and the colonies formed were counted. (B) The survival fraction was calculated under the same conditions as in (A). Data shown represent the mean ± SEM. *, P < 0.05, **, P < 0.01 (n = 6) comparing MCF-7 and MDA-MB-231 with MCF-10A under the same treatment conditions.
Figure 3
Figure 3
Effects of Mito-ChM on basal OCR and bioenergetics functions in MCF-7 and MCF-10A cells. (A) Experimental protocol for bioenergetic functional assay. To determine the mitochondrial and glycolytic function of MCF-7 and MCF-10A cells in response to Mito-ChM (1–10 μM), we used the bioenergetic functional assay previously described (4,25). After seeding and treatment, MCF-7 cells and MCF-10A cells were subsequently washed with complete media (MEM-α for MCF-7 and DMEM/F12 for MCF-10A) and either assayed immediately, or returned to a 37°C incubator for 24, 48, or 72 h. The relative time of treatment and post-treatment incubation that corresponds to the appropriate figures is indicated. (B) MCF-7 and MCF-10A cells were assayed for OCR immediately after treatment with Mito-ChM (1–10 μM) for 4 h, (C) after incubation without Mito-ChM for an additional 24 h, (D) after additional incubation without Mito-ChM for 48 h, and (E) after additional incubation without Mito-ChM for 72 h.
Figure 4
Figure 4
The effect of Mito-ChM on intracellular ATP levels in MCF-7, MDA-MB-231 and MCF-10A cells. (A) The MCF-7, MDA-MB-231 and MCF-10A cells seeded in 96-well plates were treated with Mito-ChM (1–20 μM) as indicated for 1–8 h. After treatment, cells were washed with complete media and either assayed immediately, or returned to cell culture incubator for (B) 24 h, (C) 48 h, or (D) 72 h. Intracellular ATP levels were measured using a luciferase-based assay. Data are represented as a percentage of control (non-treated) cells after normalization to total cellular protein for each well. The calculated absolute values of ATP (nmol ATP/mg protein) for MCF-7, MDA-MB-231 and MCF-10A cells are shown in Additional file 3: Tables S2, S3 and S4, respectively.
Figure 5
Figure 5
Intracellular accumulation of Mito-ChM in MCF-7, MDA-MB-231 and MCF-10A cells. (A) HPLC-EC chromatograms (dominant channels) of the mixture of standards (100 μM) of α-tocopherol and Mito-ChM, and of extracts from cells treated for 4 h with 10 μM Mito-ChM (left panel). Quantitative data on intracellular concentration of Mito-ChM after normalization to protein content (right panel). (B) Same as in panel A, but after a 4 h treatment with 10 μM Mito-ChM, medium was changed and cells incubated further for another 24 h in culture medium in the absence of Mito-ChM. Chromatogram of standards represents a mixture of α-tocopherol and Mito-ChM (10 μM each). (C) Same as in panel A, but cells were treated for 48 h with 1 μM Mito-ChM. Chromatogram of standards represents a mixture of α-tocopherol and Mito-ChM (1 μM each). (D) Same as in panel A, but cells were treated for 4 h with 10 μM Mito-ChMAc. (E) HPLC-MS/MS chromatograms [MRM transitions: 679.1 → 515.0 for Mito-ChM (upper traces) and 721.1 → 415.0 for Mito-ChMAc (lower traces)] of the mixture of standards (100 μM) of Mito-ChM and Mito-ChMAc, and of extracts from cells treated for 4 h with 10 μM Mito-ChMAc (left panel). Quantitative data on intracellular concentrations of Mito-ChM and MitoChMAc after normalization to protein content (right panel). (F) Intracellular levels of Mito-ChM in MDA-MB-231 cells incubated for 2 and 4 h with 10 μM Mito-ChM or Mito-ChMAc (left panel). Right panel shows similar data, but after 4 h incubation with the compounds, cells were incubated for 24 h in culture medium alone.
Figure 6
Figure 6
Tissue accumulation and tumor growth inhibitory activity of Mito-ChM in in vivo MDA-MB-231-luc xenograft model. (A) HPLC-MS/MS chromatograms (MRM transition: 679.1 → 515.0) of the Mito-ChM standard (1 μM), and of indicated tissue extracts from MDA-MB-231-luc tumor xenograft mice treated with Mito-ChM. Quantitative data on concentrations of Mito-ChM after normalization to tissue wet weight are shown in panel B. Tumor growth was determined by both bioluminescence signal intensity and tumor wet weight after 4 weeks of treatment. Representative bioluminescent images are show in (C). Quantitative data were plotted in panel D on bioluminescence signal intensity (left) and wet tumor weight (right). Data are represented as a percentage of control mice, mean ± SEM (n = 10, control group and n = 9, Mito-ChM treated group). *, P < 0.05 vs. control group.
Figure 7
Figure 7
Synergistic cytotoxicity and anti-proliferative effects of Mito-ChM and 2-DG. (A) Representative pictures of the colonies formed. MCF-7 and MCF-10A cells were treated with 2-DG only (upper) or 2-DG in the presence of Mito-ChM (1 μM) (lower) for 4 h and the colonies formed were counted. (B) The survival fraction was calculated under the same conditions as in (A). (C,D) Cytotoxic effects of the combination of Mito-ChM and 2-DG. MCF-7 (main panels) and MCF-10A (inserts) cells were treated with 2-DG alone (at the indicated concentrations), 2-DG in the presence of 1 μM Mito-ChM (C) or 1 μM Mito-ChMAc (D) for 24 h and cell death was monitored in real time by Sytox Green staining. Data shown are the mean ± SEM. n = 4-6.

References

    1. Hsu PP, Sabatini DM. Cancer cell metabolism: Warburg and beyond. Cell. 2008;134:703–707. doi: 10.1016/j.cell.2008.08.021. - DOI - PubMed
    1. Barger JF, Plas DR. Balancing biosynthesis and bioenergetics: metabolic programs in oncogenesis. Endocr Relat Cancer. 2010;17:R287–R304. doi: 10.1677/ERC-10-0106. - DOI - PubMed
    1. Vander Heiden MG, Cantley LC, Thompson CB. Understanding the Warburg effect: the metabolic requirements of cell proliferation. Science. 2009;324:1029–1033. doi: 10.1126/science.1160809. - DOI - PMC - PubMed
    1. Cheng G, Zielonka J, Dranka BP, McAllister D, Mackinnon AC Jr, Joseph J, Kalyanaraman B. Mitochondria-targeted drugs synergize with 2-deoxyglucose to trigger breast cancer cell death. Cancer Res. 2012;72:2634–2644. doi: 10.1158/0008-5472.CAN-11-3928. - DOI - PMC - PubMed
    1. Beckham TH, Lu P, Jones EE, Marrison T, Lewis CS, Cheng JC, Ramshesh VK, Beeson G, Beeson CC, Drake RR, Bielawska A, Bielawski J, Szulc ZM, Ogretmen B, Norris JS, Liu X. LCL124, a cationic analog of ceramide, selectively induces pancreatic cancer cell death by accumulating in mitochondria. J Pharmacol Exp Ther. 2013;344:167–178. doi: 10.1124/jpet.112.199216. - DOI - PMC - PubMed

Publication types