. 2013 Jun 5;78(5):773-84.
doi: 10.1016/j.neuron.2013.03.025.

Permanent genetic access to transiently active neurons via TRAP: targeted recombination in active populations

Affiliations

Permanent genetic access to transiently active neurons via TRAP: targeted recombination in active populations

Casey J Guenthner et al. Neuron. .

Erratum in

  • Neuron. 2013 Sep 18;79(6):1257

Abstract

Targeting genetically encoded tools for neural circuit dissection to relevant cellular populations is a major challenge in neurobiology. We developed an approach, targeted recombination in active populations (TRAP), to obtain genetic access to neurons that were activated by defined stimuli. This method utilizes mice in which the tamoxifen-dependent recombinase CreER(T2) is expressed in an activity-dependent manner from the loci of the immediate early genes Arc and Fos. Active cells that express CreER(T2) can only undergo recombination when tamoxifen is present, allowing genetic access to neurons that are active during a time window of less than 12 hr. We show that TRAP can provide selective access to neurons activated by specific somatosensory, visual, and auditory stimuli and by experience in a novel environment. When combined with tools for labeling, tracing, recording, and manipulating neurons, TRAP offers a powerful approach for understanding how the brain processes information and generates behavior.


Figures

Figure 1
Figure 1. Strategy of Targeted Recombination in Active Populations (TRAP)
(A) TRAP requires two transgenes: one that expresses CreERT2 from an activity-dependent IEG promoter and one that allows expression of an effector gene, such as tdTomato, in a Cre-dependent manner. Without tamoxifen (TM), CreERT2 is retained in the cytoplasm of active cells in which it is expressed, so no recombination can occur (top). In the presence of TM, CreERT2 recombination can occur in active cells (bottom), while non-active cells do not undergo recombination, because they do not express CreERT2. (B and C) Schematics of the wild-type and CreERT2 knock-in alleles of Fos (B) and Arc (C). Rectangles indicate exons, and protein-coding regions are shaded grey. Arrows indicate translational start sites. See also Figure S1.
Figure 2
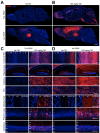
Figure 2. Background and Homecage Recombination in FosTRAP and ArcTRAP Mice
(A and B) Full sagittal views of FosTRAP (top) and ArcTRAP (bottom) brains from 6-8 week old mice that were either uninjected (A) or that were treated with TM in the homecage and then sacrificed 1 week post-injection (B). Scale bar, 1 mm. (C and D) Magnified views from uninjected (left columns) or homecage TM-treated (right columns) FosTRAP (C) and ArcTRAP (D) brains. Images are representative of at least n=3 mice examined per condition. The thalamus images are of the ventral posteromedial (VPM) thalamus, a somatosensory thalamic nucleus. S1BF, primary somatosensory barrel field; CPu, caudate putamen; gl, glomerular layer; epl, external plexiform layer; mcl, mitral cell layer; ipl, internal plexiform layer; gcl, granule cell layer; ml, molecular layer; p, Purkinje cell layer; wm, white matter. Numbers indicate cortical layers. Scale bar, 100 μm. See also Figure S2.
Figure 3
Figure 3. FosTRAP in Barrel Cortex of Whisker-Plucked Mice
(A) Experimental scheme: FosTRAP mice had either all whiskers except C2 plucked unilaterally or had only the C2 whisker plucked. After a 2-day recovery, mice were injected with 150 mg/kg TM, and recombination was examined 7 days later. (B) Tangential views of flattened layer 4 of primary somatosensory barrel cortex (top) or coronal views through the C2 barrel (bottom). White dots indicate the corners of the C2 barrel based on dense DAPI staining of the barrel walls. Compared with controls (left), removal of only the C2 whisker results in elimination of TRAP signal from the C2 barrel (middle), while removal of all whiskers except C2 results in absence of most TRAPed cells in all barrels except C2 (right). The left and middle images are from the same mouse. Images are representative of at least 3-4 mice for each condition. Scale bar, 250 μm. See also Figure S3.
Figure 4
Figure 4. Time Window for Effective TRAPing Relative to Drug Injection in Primary Visual Cortex
(A) Experimental scheme: FosTRAP mice were placed in constant darkness for 2 days and were then given injections of either 150 mg/kg TM or 50 mg/kg 4-OHT at varying times relative to a 1 h diffuse light stimulus. Mice remained in darkness for three days following drug injection and were sacrificed seven days later. (B and C) Representative images of primary visual (V1; top rows) and somatosensory (S1; bottom rows) cortices in mice treated with TM (B) or 4-OHT (C) at different times relative to the light stimulus. Scale bar, 250 μm. (D) Quantification (mean ± SEM, n=4-7 mice per time point) of the density of TRAPed cells in V1 and S1, normalized to the mean density of TRAPed cells in the dark condition for both TM (top) and 4-OHT (bottom). In S1 of mice treated with either drug, light stimulation did not increase the number of TRAPed cells over dark levels (ANOVAs, p>0.3). For V1, the window for TRAPing was longer and had a later peak for TM than for 4-OHT. ***, significantly different from the dark condition for V1 (p <0.001, Tukey’s post-hoc test after significant ANOVA); all other time points were not significantly different from dark (p > 0.05). See also Figures S4 and S5.
Figure 5
Figure 5. TRAPing Cells that Respond to Specific Frequencies of Auditory Stimuli
(A) Experimental scheme: FosTRAP mice were placed in sound isolation chamber for 24 h, during which they received a 4 h pure tone stimulus (magenta bar); in the middle of the stimulus, they were injected with 50 mg/kg 4-OHT. 4-5 days later, they were returned to the sound isolation chambers, where they received a 1 h pure tone stimulus (green bar) ending 1 h before they were sacrificed. (B) Exemplary images of the dorsal, anteroventral, and posteroventral cochlear nuclei (DCN, AVCN, and PVCN, respectively), the cores of which are outlined with white dots based on a DNA counterstain (not shown). Fos immunostaining is green, and magenta is tdTomato fluorescence from TRAP. For the group names above each column, the frequencies represented by the TRAPed and Fos+ cells are indicated in magenta and green, respectively. Magenta and green arrows indicate the qualitative centers of TRAPed and Fos+ cell clusters, respectively, within each subdivision. The CN borders include granule cells that receive extensive non-auditory input (Young and Oertel, 2004) and that are thus TRAPed independently of the delivered stimulus. Similar results were observed in all 3-4 mice in each group. Scale bar, 250 μm. (C) Quantification of tonotopy in the DCN. Sections from the middle third of the rostrocaudal extent of the DCN were separated into bins along the dorsoventral axis (shown in the upper-left panel in B), and the numbers of TRAPed (magenta histogram) and Fos+ (green histogram) cells (excluding granule cells) were counted for each bin and pooled across sections and animals. Total cell counts are 300-700 for the each of the Fos+ (green) histograms and 800-1500 for each of the TRAP (magenta) histograms. Regardless of whether the neuronal representation was measured by Fos immunostaining or by TRAP, the higher frequency tone activated cells localized more dorsally than the lower frequency tone. (D) Quantification (mean ± SEM, n=3-4 mice per condition) of co-labeling between TRAP and Fos immunostaining. For both plots, all groups were significantly different from each other (Tukey’s post hoc tests, p<0.05 after ANOVA, p<0.001), except for 4kHz-4kHz vs. 16kHz-16kHz and 16kHz-4kHz vs. 4kHz-16kHz (p>0.05).
Figure 6
Figure 6. TRAPing Cells Activated by Exploration of a Novel Environment
(A) Representative images of the hippocampus from FosTRAP mice that were injected with vehicle or 50 mg/kg 4-OHT while exploring a novel environment for 2 h (left and right, respectively) or that were injected with 50 mg/kg 4-OHT in the homecage (middle). Mice were sacrificed one week after injection. Higher magnification images of CA1 (middle) and the DG (bottom) correspond to the boxed regions in the top row. Virtually no cells were TRAPed in the vehicle-injected mice. In 4-OHT-injected mice, exploration of a novel environment led to an increase in TRAPed DG granule and CA1 pyramidal cells, compared to mice left in the homecage. In the DG, TRAPed cells were located mostly in the upper (suprapyramidal) blade, indicated in the lower left panel as the region above the yellow line bisecting the genu. The highly TRAPed region in the upper right panel (†) is barrel cortex (see Figure S6). TRAPing of cells with axons innervating the DG also increases with novel environment exposure, as indicated by the increase in diffuse tdTomato labeling of the DG molecular layer (*). Scale bar, 100 μm. (B) Quantification (mean ± SEM) of numbers of TRAPed DG granule cells and CA3 and CA1 pyramidal cells in mice treated with 4-OHT in the homecage (n=6) or during exploration of a novel environment (n=6) or in mice treated with vehicle while exploring a novel environment (n=3). Cell counts represent the total numbers of cells observed on one side of the hippocampus in every fourth coronal section across all but the most caudal portion of the hippocampus. Novel environment exploration significantly increased the numbers of TRAPed DG granule cells and CA1 pyramidal cells (***, p <0.001; **, p<0.01; Tukey’s post-hoc test after a significant 2-way ANOVA with brain region and treatment as factors; statistical results for the vehicle controls were not determined due to the small number of cells observed in that condition). (C) Quantification (mean ± SEM) of density of TRAPed DG granule cells in the upper and lower blades of the DG in mice treated with 4-OHT in the homecage or while exploring a novel environment. (***, p <0.001, Tukey’s post-hoc test; *, p<0.05, blade X treatment interaction by 2-way ANOVA). See also Figures S6.

Similar articles

Cited by

References

    1. Amir S, Robinson B. Fos expression in rat visual cortex induced by ocular input of ultraviolet light. Brain Res. 1996;716:213–218. - PubMed
    1. Armstrong-James M, Fox K, Das-Gupta A. Flow of excitation within rat barrel cortex on striking a single vibrissa. J. Neurophysiol. 1992;68:1345–1358. - PubMed
    1. Barth AL, Gerkin RC, Dean KL. Alteration of neuronal firing properties after in vivo experience in a fosgfp transgenic mouse. J. Neurosci. 2004;24:6466–6475. - PMC - PubMed
    1. Chawla MK, Guzowski JF, Ramirez-Amaya V, Lipa P, Hoffman KL, Marriott LK, Worley PF, McNaughton BL, Barnes CA. Sparse, environmentally selective expression of arc rna in the upper blade of the rodent fascia dentata by brief spatial experience. Hippocampus. 2005;15:579–586. - PubMed
    1. Deng X, Ladenheim B, Tsao L-I, Cadet JL. Null mutation of c-fos causes exacerbation of methamphetamine-induced neurotoxicity. J. Neurosci. 1999;19:10107–10115. - PMC - PubMed

Publication types

MeSH terms