. 2013 Jun 5;78(5):785-98.
doi: 10.1016/j.neuron.2013.05.029.

Rapid single-step induction of functional neurons from human pluripotent stem cells

Affiliations

Rapid single-step induction of functional neurons from human pluripotent stem cells

Yingsha Zhang et al. Neuron. .

Abstract

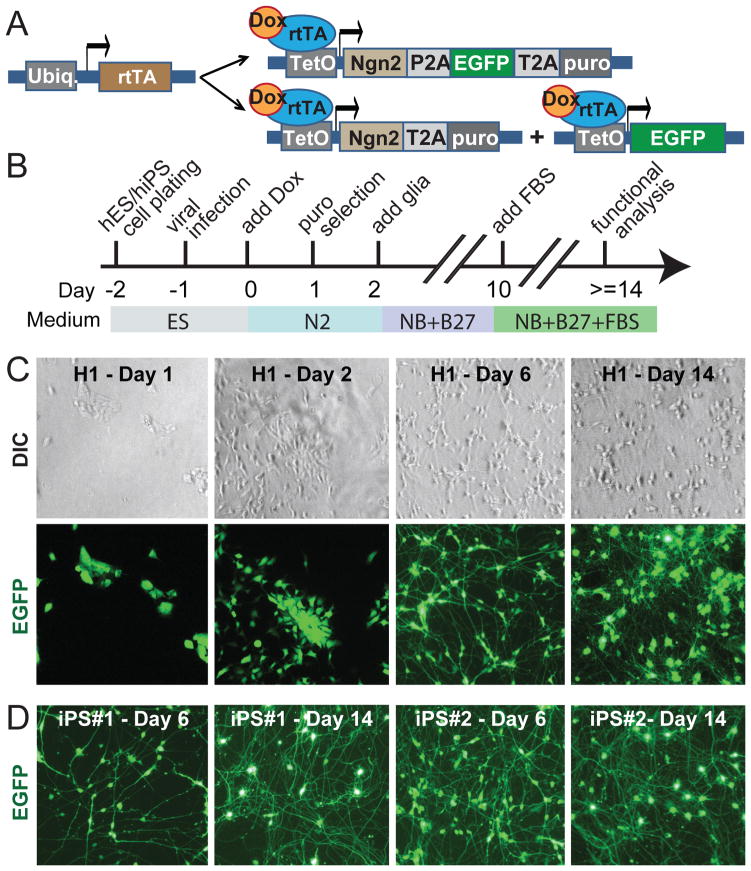
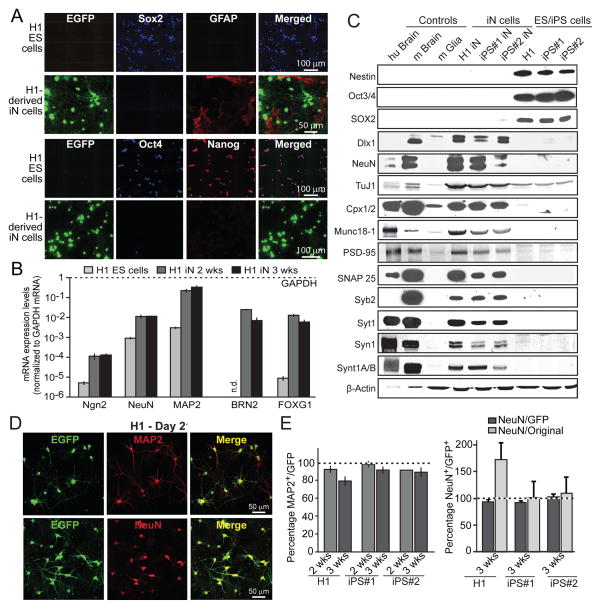
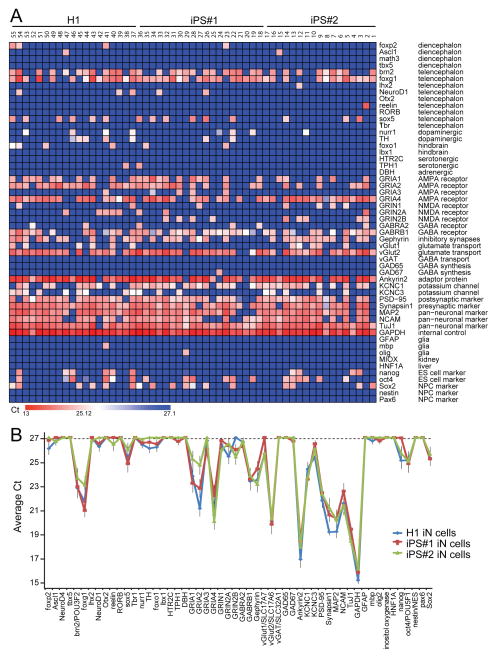
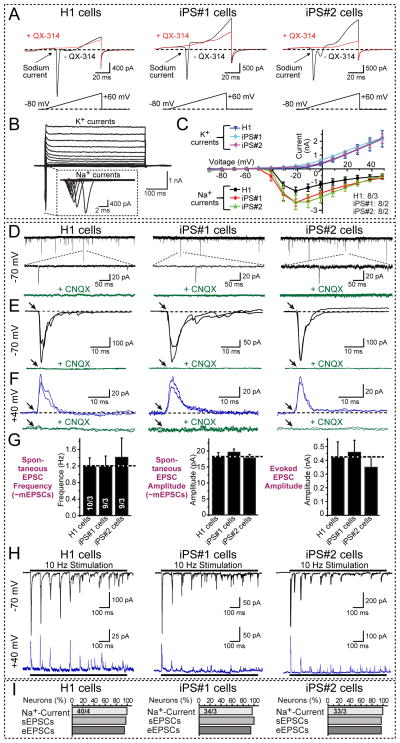
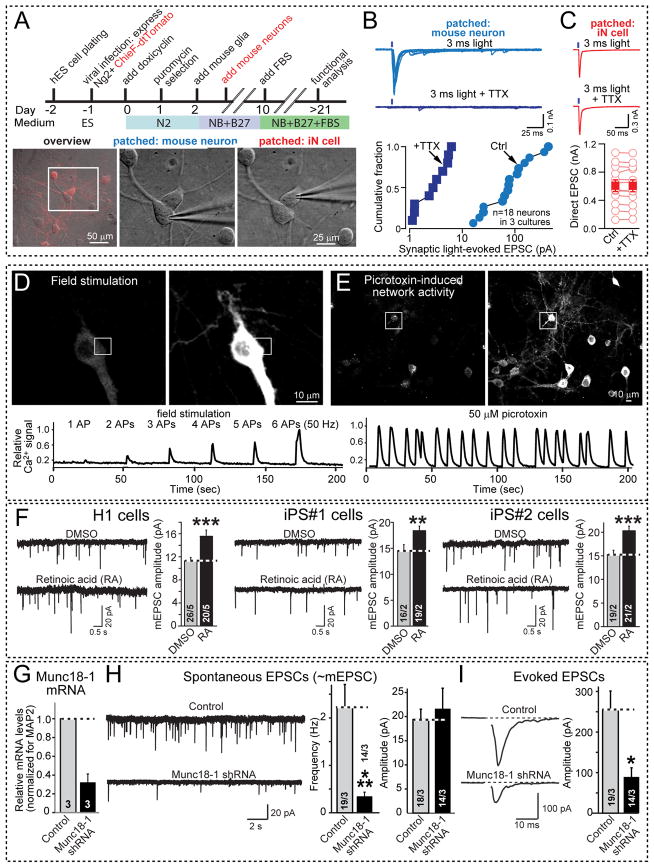
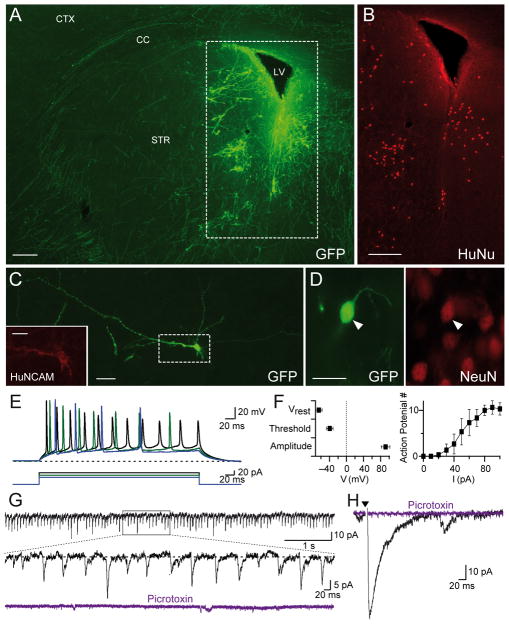
Available methods for differentiating human embryonic stem cells (ESCs) and induced pluripotent cells (iPSCs) into neurons are often cumbersome, slow, and variable. Alternatively, human fibroblasts can be directly converted into induced neuronal (iN) cells. However, with present techniques conversion is inefficient, synapse formation is limited, and only small amounts of neurons can be generated. Here, we show that human ESCs and iPSCs can be converted into functional iN cells with nearly 100% yield and purity in less than 2 weeks by forced expression of a single transcription factor. The resulting ES-iN or iPS-iN cells exhibit quantitatively reproducible properties independent of the cell line of origin, form mature pre- and postsynaptic specializations, and integrate into existing synaptic networks when transplanted into mouse brain. As illustrated by selected examples, our approach enables large-scale studies of human neurons for questions such as analyses of human diseases, examination of human-specific genes, and drug screening.


Figures

Figure 1
Figure 1. Rapid single-step generation of human iN cells
A, Design of lentiviral vectors for Ngn2-mediated conversion of ES and iPS cells to iN cells. Cells are transduced with (i) a virus expressing rtTA and (ii) either a single additional virus expressing an Ngn2/EGFP/puromycin resistance gene as a fusion protein linked by P2A and T2A sequences, or with two viruses that separately express Ngn2/puromycin resistance gene and EGFP. B, Flow diagram of iN cell generation. C, Representative images illustrating the time course of the conversion of H1 ES cells into iN cells. Corresponding differential interference contrast (DIC) and GFP fluorescence pictures are shown on top and bottom. D, Representative images of converted iN cells from two different iPS cells lines at day 6 and day 14. Note that iN cells are clearly identifiable already on day 6. For iN cells generated with NeuroD1 expression, see Fig. S1.
Figure 2
Figure 2. Characterization of the properties and yield of Ngn2-generated iN cells
A, Immunofluorescence images of H1 ES cells and H1 ES cell-derived iN cells (3 weeks after induction). H1 ES but not iN cells are positive for the ES cell markers Nanog, Sox2 and Oct4, while GFAP is only present in co-cultured astrocytes but not iN or ES cells. B, Quantification of selected mRNA levels in H1 ES cells and in H1 ES-cell derived iN cells after 2 and 3 weeks of lentiviral infection. Levels are normalized for GAPDH mRNA levels as an internal control, and are shown on a logarithmic scale. Note that endogenous Ngn2 is induced ~20-fold, and endogenous Brain-2 and FOXG1 expression is induced >1,000-fold. Data are means ± SEM (n=3 independent experiments). C, Immunoblot analyses of proteins extracted from human postmortem cortex (hu Brain), mouse brain (m Brain), and cultured mouse glia cells (m Glia), and of proteins solubilized from iN cells that were derived from H1 ES and two different iPS cell lines (3 weeks after induction) and from the starting ES and iPS cells as indicated. Proteins are identified on the left (Cpx1/2, complexin-1 and −2; Syb2, synaptobrevin-2; Syt1, synaptotagmin-1; Syn1, synapsin-1; Synt1A/B, syntaxin-1A and -1B). D, Representative images of H1 ES-cell derived iN cells visualized via their EGFP fluorescence and immunolabelled for MAP2 or NeuN as indicated. E, Yield of iN cell conversion of H1 ES cells and two different iPS cell lines. The percentage of EGFP-positive cells that also express the neuronal marker MAP2 after 2 or 3 weeks of conversion is shown on the left, and the yield of NeuN-positive cells at the right. NeuN-positive cell yields are calculated both in terms of the percentage of EGFP-positive cells (dark bars) or in terms of starting cell numbers (light bars). For the latter, the yield exceeds 100% for H1-derived but not iPS-derived iN cells because H1 cells still proliferate after lentiviral infection, while iPS cells do not because they are more sensitive to lentivirally induced cell death. Data are means ± SEMs (n=3 independent experiments). For additional data, see Fig. S2.
Figure 3
Figure 3. iN cell generation involves reproducible changes in gene expression
A, Single-cell quantitative RT-PCR analysis (Fluidigm) of the expression levels of the genes indicated on the right. Expression levels (expressed as Ct values) are color coded as shown on the bottom. mRNA levels were quantified in cytoplasm aspirated from individual iN cells using patch pipettes after 3 weeks of induction. B, Comparison of gene expression profiles in iN cells differentiated from H1 ES and two different lines of iPS cells. The plot depicts average Ct values of the genes indicated at the bottom, with a cutoff of 27 cycles (on top of the 18 cycle pre-amplification). For more extensive analyses of further marker genes, see Fig. S3.
Figure 4
Figure 4. iN cells derived from ES and iPS cells form functional synapses
A, Representative traces of membrane currents (upper panel) recorded following a ramp depolarization protocol (lower panel). Na+-currents were blocked by QX-314 (10 mM). B, Representative traces of whole-cell voltage-clamp Na+- and K+-currents recorded in iN cells. iN cells were subjected to 10 mV step depolarizations from −90 mV to +50 mV at a −70 mV holding potential (pipette solution (in mM): 123 K-gluconate, 10 KCl, 1 MgCl2, 10 HEPES-KOH pH 7.2, 1 EGTA, 0.1 CaCl2, 1 K2ATP, 0.2 Na4GTP and 4 glucose). C, Quantification of I/V curves of Na+- and K+-currents in iN cells derived from H1 ES cells and from two different iPS cell lines. Data are means ± SEMs; numbers of cells/cultures analyzed are shown on the right lower corner. D, Representative traces of spontaneous EPSCs (likely mEPSCs based on size); middle panels depict expansions of selected events. The lower traces display block of spontaneous EPSCs by 50 μM CNQX. E & F, Representative traces of evoked EPSCs monitored at −70 mV (E) and at +40 mV (F); lower panels show that CNQX completely blocks all EPSCs. Two superimposed traces are shown. G, Quantification of the frequency (left panel) and amplitude of spontaneous EPSCs (middle panel) and of the amplitude of evoked EPSCs (right panel). Data are means ± SEM; numbers in the left bars indicate the number of cells/independent experiments performed, and apply to all panels. Note that iN cells derived from different ES/iPS cell lines exhibit quantitatively similar synaptic properties. H, Representative traces of EPSCs evoked by a 10 Hz stimulus train applied for 1 s and monitored at −70 mV (top traces) and +40 mV (bottom traces). I, Quantification of the rate of successful observations of voltage-gated Na+-currents, spontaneous EPSCs (sEPSCs), and evoked EPSCs (eEPSCs) in iN cells. Numbers in top bars indicate the number of cells/independent experiments performed.
Figure 5
Figure 5. Use of rapidly induced human iN cells for characterizing human synapses and modeling human diseases
A–C, Optogenetic mapping of functional presynaptic specializations formed by iN cells onto co-cultured cortical mouse neurons. A, Strategy for the generation of channelrhodopsin-expressing iN cells (top), and combined tdTomato fluorescence and DIC images (overview) or DIC images only (images of patched mouse neurons and iN cells) to illustrate the selectively patching human iN cells or mouse neurons (bottom). ES cells were co-infected with lentivirus expressing the channelrhodopsin variant CHIEF as a td-Tomato fusion protein at the time of Ngn2 transduction. B, Synaptic responses triggered by presynaptic optogenetic stimulation of iN cells and monitored in postsynaptic mouse neurons (top, representative traces; bottom, summary graph of the evoked EPSC amplitudes). Responses were triggered by 3 ms blue light pulses without or with 0.5 μM TTX (to block presynaptic action potentials induced by channelrhodopsin). C, Channelrhodopsin-mediated presynaptic depolarizations monitored in human iN cells (top, representative traces; bottom, summary graph of the light-evoked EPSC). As in B, responses were triggered by light pulses in the absence or presence of 0.5 μM TTX, but TTX has no effect because the recorded current is directly induced by channelrhodopsin activation which is not inhibited by TTX. D & E, Ca2+-imaging of human iN cells. D, Representative images of GCaMP6M-expressing iN cells cultured alone (top) or E, of co-cultured with cortical primary neurons (top) in the absence (left panels) or presence of a Ca2+-signal (right panels). Traces of Ca2+-signals induced by field stimulation (D; indicated action potential (AP) inducing pulses were delivered at 50 Hz) or by network activity triggered by 0.1 mM picrotoxin (E) monitored in these iN cells are shown on the bottom. F, iN cells derived from H1 ES cells or two different iPS cell lines exhibit retinoic acid (RA) dependent increases in synaptic strength as a model of homeostatic plasticity. iN cells were incubated with 1 μM RA for 45 min, and the amplitude of spontaneous miniature EPSCs (mEPSCs) was recorded in TTX (T-test,). Data shown are means ± SEMs (n = 12 cells/3 independent experiments for DMSO, and 14/3 for RA treatments; statistical significance was assessed by Student’s t-test; **P<0.01; ***P<0.001). G–I, Effect of a Munc18-1 loss-of-function on synaptic transmission in human iN cells. G, quantification of the Munc18-1 knockdown (KD) efficiency in iN cells. Munc18-1 mRNA levels were measured by quantitative RT-PCR in conrol iN cells and iN cells infected with Munc18-1 KD lentivirus, and normalized to MAP2 as an endogenous control (n=3 independent experiments). H, Representative traces of spontaneous EPSCs monitored in control and Munc18-1 KD iN cells from H1 ES cells (left), and quantifications of the frequency (center) and amplitudes of spontaneous EPSCs (right). Numbers of cells/ independent experiments performed are indicated; I, Representative traces of evoked EPSCs of control and Munc18-1 KD iN cells derived from H1 cells (left), and quantification of spontaneous EPSCs amplitudes (right). Numbers of cells/independent experiments performed are shown in the bars. Data are means ± SEMs; statistical significance was assessed by Student’s t-test (*P<0.05; ***P<0.001).
Figure 6
Figure 6. Functional integration of transplanted H1-derived iN cells into mouse brain
A, Representative image of EGFP-expressing iN cells in mouse striatum. Note dispersion of the iN cells into the parenchyma (CC, corpus callosum; CTX, cortex; LV, lateral ventricle; STR, striatum; scale bar: 200 μm). B, Labeling of the area in A. with antibodies to the marker protein HuNu specific for human neurons (scale bar: 200 μm). C, Morphology of a single EGFP- and human NCAM- positive iN cells after transplantation (scale bars: 20 μm and 10 μm (inset)). D, Example of an EGFP-positive human iN cell (left panel) that is co-labeled with NeuN (right panel; scale bar: 20 μm). E, Example traces showing action-potential generation (upper traces) in response to current pulses (lower traces) applied with 10 pA step sizes. For the recording configuration from transplanted iN cells, see Fig. S6. F, Average resting membrane potential (Vrest), action-potential threshold (Threshold), and action-potential height (Height) measured in transplanted iN cells (n = 4, left panel). Number of action-potentials (AP #) plotted against current pulse values (n = 4, right panel). G, Representative traces of spontaneous postsynaptic inhibitory currents (IPSCs) monitored in transplanted iN cells; currents are blocked by picrotoxin. I, Evoked IPSCs elicited by extracellular stimulation (arrowhead) and blocked by addition of picrotoxin in transplanted iN cells.

References

    1. Akerboom J, et al. Optimization of a GCaMP calcium indicator for neural activity imaging. J Neurosci. 2012;32:13819–13840. - PMC - PubMed
    1. Ambasudhan R, Talantova M, Coleman R, Yuan X, Zhu S, Lipton SA, Ding S. Direct reprogramming of adult human fibroblasts to functional neurons under defined conditions. Cell Stem Cell. 2011;9:113–118. - PMC - PubMed
    1. Biederer T, Sara Y, Mozhayeva M, Atasoy D, Liu X, Kavalali ET, Südhof TC. SynCAM, a synaptic adhesion molecule that drives synapse assembly. Science. 2002;297:1525–1531. - PubMed
    1. Blanpain C, Daley GQ, Hochedlinger K, Passegué E, Rossant J, Yamanaka S. Stem cells assessed. Nat Rev Mol Cell Biol. 2012;13:471–476. - PubMed
    1. Brennand KJ, Simone A, Tran N, Gage FH. Modeling psychiatric disorders at the cellular and network levels. Mol Psychiatry. 2012 doi: 10.1038/mp.2012.20. [Epub ahead of print] - DOI - PMC - PubMed

Publication types

MeSH terms