

Interlaboratory study on differential analysis of protein glycosylation by mass spectrometry: the ABRF glycoprotein research multi-institutional study 2012
- PMID: 23764502
- PMCID: PMC3790302
- DOI: 10.1074/mcp.M113.030643
Interlaboratory study on differential analysis of protein glycosylation by mass spectrometry: the ABRF glycoprotein research multi-institutional study 2012
Abstract
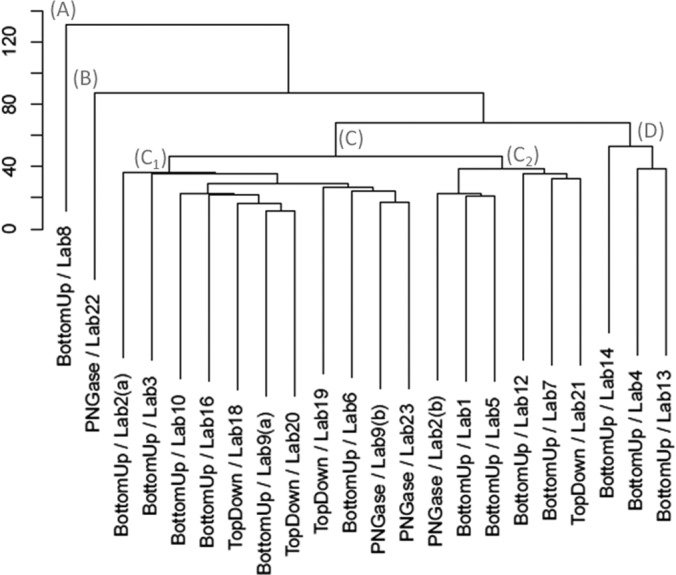
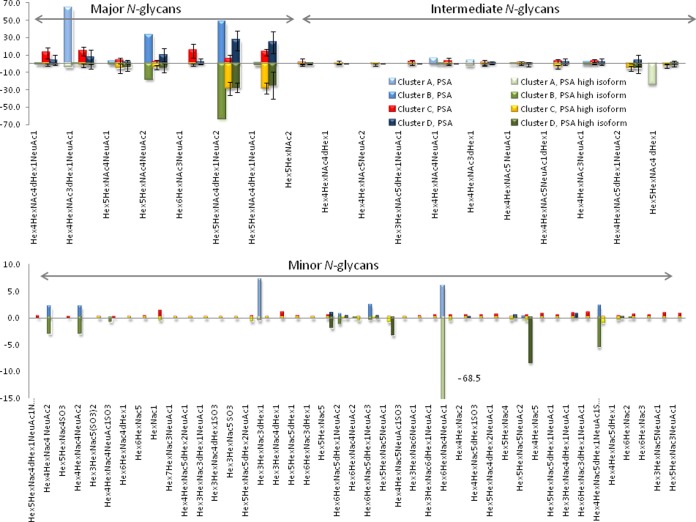
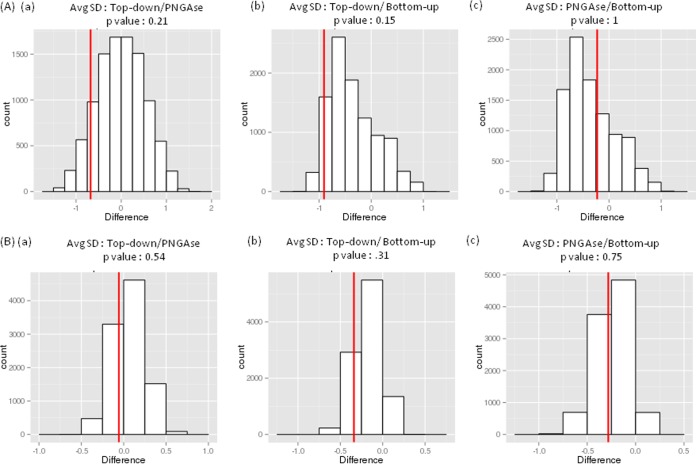
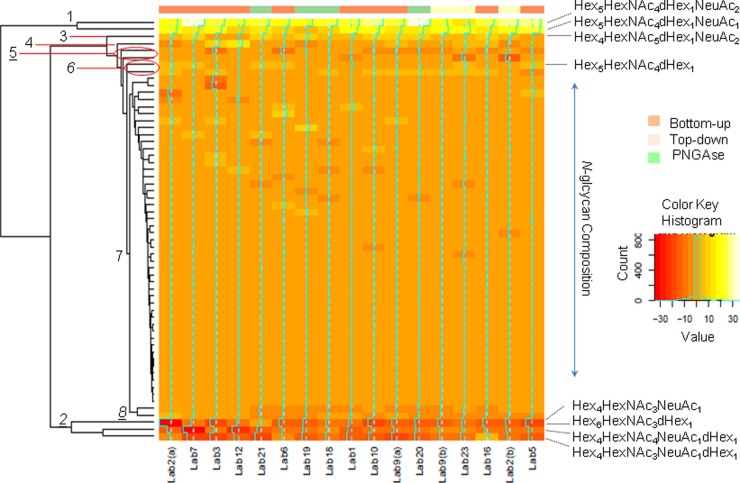
One of the principal goals of glycoprotein research is to correlate glycan structure and function. Such correlation is necessary in order for one to understand the mechanisms whereby glycoprotein structure elaborates the functions of myriad proteins. The accurate comparison of glycoforms and quantification of glycosites are essential steps in this direction. Mass spectrometry has emerged as a powerful analytical technique in the field of glycoprotein characterization. Its sensitivity, high dynamic range, and mass accuracy provide both quantitative and sequence/structural information. As part of the 2012 ABRF Glycoprotein Research Group study, we explored the use of mass spectrometry and ancillary methodologies to characterize the glycoforms of two sources of human prostate specific antigen (PSA). PSA is used as a tumor marker for prostate cancer, with increasing blood levels used to distinguish between normal and cancer states. The glycans on PSA are believed to be biantennary N-linked, and it has been observed that prostate cancer tissues and cell lines contain more antennae than their benign counterparts. Thus, the ability to quantify differences in glycosylation associated with cancer has the potential to positively impact the use of PSA as a biomarker. We studied standard peptide-based proteomics/glycomics methodologies, including LC-MS/MS for peptide/glycopeptide sequencing and label-free approaches for differential quantification. We performed an interlaboratory study to determine the ability of different laboratories to correctly characterize the differences between glycoforms from two different sources using mass spectrometry methods. We used clustering analysis and ancillary statistical data treatment on the data sets submitted by participating laboratories to obtain a consensus of the glycoforms and abundances. The results demonstrate the relative strengths and weaknesses of top-down glycoproteomics, bottom-up glycoproteomics, and glycomics methods.
Figures
References
-
- Cummings R. D. (2009) The repertoire of glycan determinants in the human glycome. Mol. Biosyst. 5, 1087–1104 - PubMed
-
- Varki A., Cummings R. D., Esko J. D., Freeze H. F., Stanley P., Bertozzi C. R., Hart G. W., Etzler M. E. (2009) Essentials of Glycobiology, 2nd ed., Cold Spring Harbor Laboratory Press, Cold Spring Harbor, NY - PubMed
-
- Fuster M. M., Esko J. D. (2005) The sweet and sour of cancer: glycans as novel therapeutic targets. Nat. Rev. Cancer 5, 526–542 - PubMed
-
- Kannagi R., Yin J., Miyazaki K., Izawa M. (2008) Current relevance of incomplete synthesis and neo-synthesis for cancer-associated alteration of carbohydrate determinants. Biochim. Biophys. Acta 1780 - PubMed
Publication types
MeSH terms
Substances
Grants and funding
- S10 RR 025082/RR/NCRR NIH HHS/United States
- R01 AI094797/AI/NIAID NIH HHS/United States
- S10 RR025082/RR/NCRR NIH HHS/United States
- P41 P41GM104603/GM/NIGMS NIH HHS/United States
- S10 RR 020946/RR/NCRR NIH HHS/United States
- N01 HV 00239/HV/NHLBI NIH HHS/United States
- S10 RR 015942/RR/NCRR NIH HHS/United States
- S10 OD010731/OD/NIH HHS/United States
- P41 GM104603/GM/NIGMS NIH HHS/United States
- R01 098050/PHS HHS/United States
- R01 GM103547/GM/NIGMS NIH HHS/United States
- S10 RR020946/RR/NCRR NIH HHS/United States
- R01 DE020925/DE/NIDCR NIH HHS/United States
LinkOut - more resources
Full Text Sources
Other Literature Sources
Medical
Research Materials
Miscellaneous
