. 2013 Oct;21(10):1898-908.
doi: 10.1038/mt.2013.144. Epub 2013 Jun 14.

Toward RNAi therapy for the polyglutamine disease Machado-Joseph disease

Affiliations

Toward RNAi therapy for the polyglutamine disease Machado-Joseph disease

Maria do Carmo Costa et al. Mol Ther. 2013 Oct.

Abstract

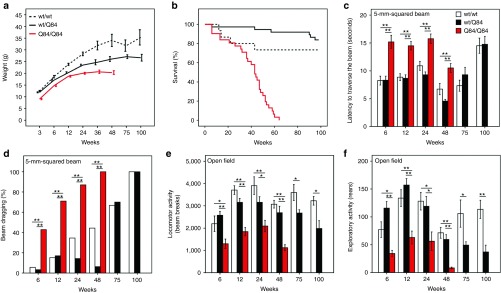
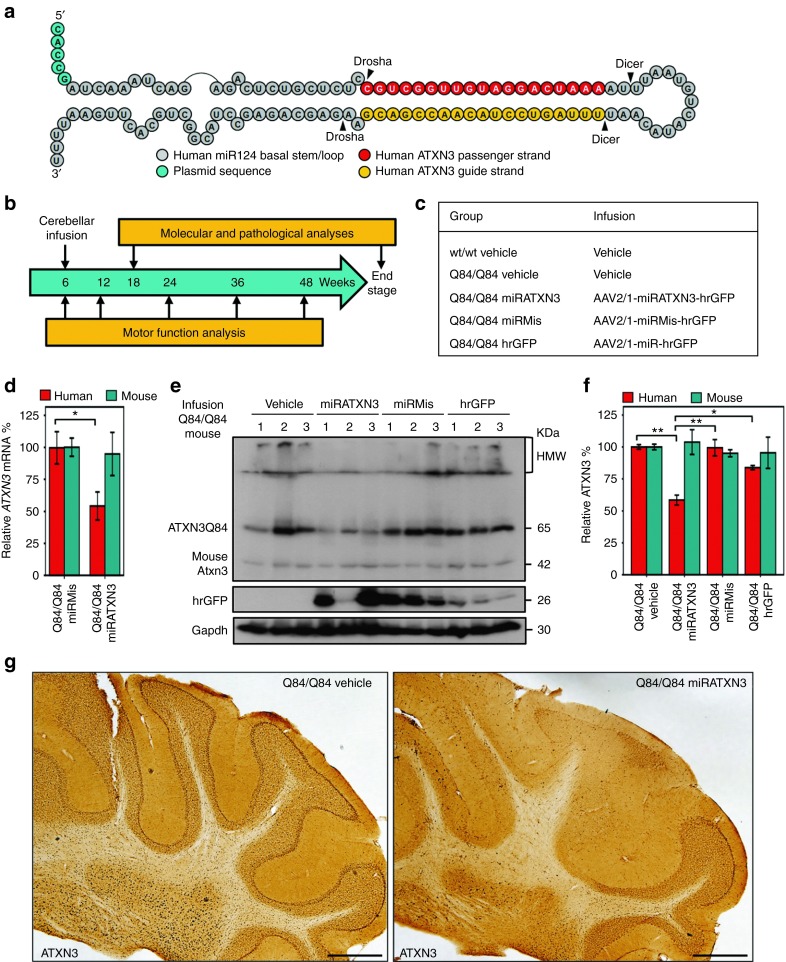
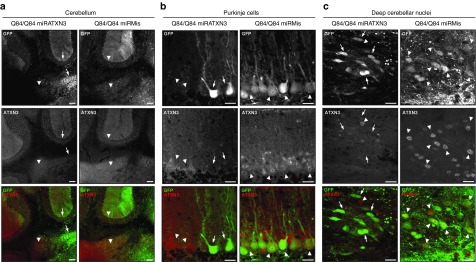
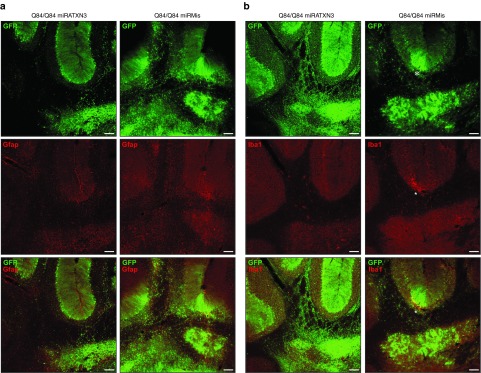
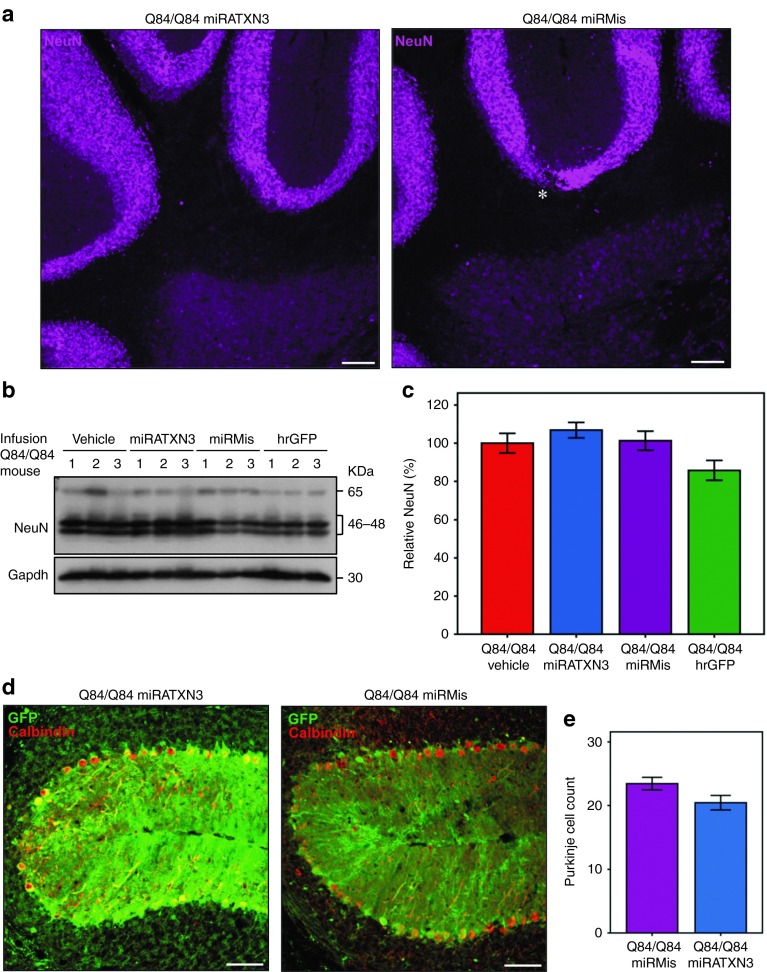
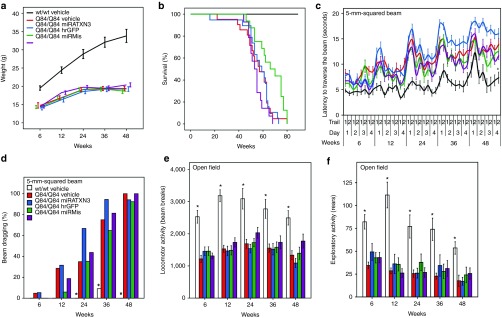
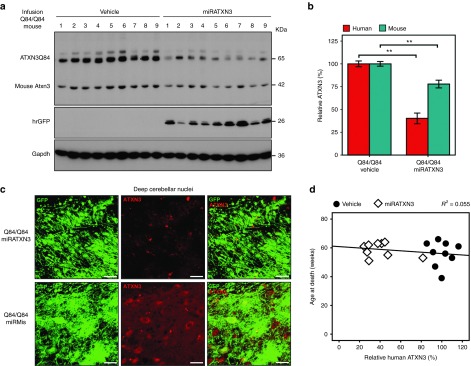
Machado-Joseph disease (MJD) is a dominantly inherited ataxia caused by a polyglutamine-coding expansion in the ATXN3 gene. Suppressing expression of the toxic gene product represents a promising approach to therapy for MJD and other polyglutamine diseases. We performed an extended therapeutic trial of RNA interference (RNAi) targeting ATXN3 in a mouse model expressing the full human disease gene and recapitulating key disease features. Adeno-associated virus (AAV) encoding a microRNA (miRNA)-like molecule, miRATXN3, was delivered bilaterally into the cerebellum of 6- to 8-week-old MJD mice, which were then followed up to end-stage disease to assess the safety and efficacy of anti-ATXN3 RNAi. Despite effective, lifelong suppression of ATXN3 in the cerebellum and the apparent safety of miRATXN3, motor impairment was not ameliorated in treated MJD mice and survival was not prolonged. These results with an otherwise effective RNAi agent suggest that targeting a large extent of the cerebellum alone may not be sufficient for effective human therapy. Artificial miRNAs or other nucleotide-based suppression strategies targeting ATXN3 more widely in the brain should be considered in future preclinical tests.


Figures

Figure 1
Figure 1
Homozygous YACMJDQ84.2 transgenic mice (Q84/Q84) display a robust, early-onset phenotype. Comparison of phenotypic features in nontransgenic (wt/wt), hemizygous (wt/Q84), and homozygous (Q84/Q84) mice. (a) Q84/Q84 mice (red) show a decrease in body weight gain compared with wt/wt (dashed black) and wt/Q84 (black) littermates (note: nonlinear X axis). (b) Kaplan–Meier survival curves show reduced survival of Q84/Q84 mice (wt/wt n = 15; wt/Q84 n = 37; Q84/Q84 n = 31). (c,d) Early motor impairment of Q84/Q84 mice on the 5-mm-squared beam walking test, manifested by (c) increased latency to traverse the beam (bars represent the mean of two consecutive trials on day 4 of testing ± SEM) and (d) progressive hind limb dragging (bars represent frequency of dragging on day 4). (e,f) Q84/Q84 mice display decreased locomotor (beam breaks, e) and exploratory activity (number of rears, f) on the open-field test during 30 minutes (bars represent mean ± SEM). Test groups used in motor tests ranged from n = 6–15 for each specific age. Statistical significance of *P < 0.05 and **P < 0.005 is indicated.
Figure 2
Figure 2
Homozygous Q84/Q84 transgenic mice recapitulate Machado–Joseph disease neuropathology in the cerebellum. (a) Immunohistochemistry with anti-ATXN3 antibody (1H9) reveals neuronal nuclear accumulation of ATXN3 and aggregates in wt/Q84 and Q84/Q84 mice in the deep cerebellar nuclei (DCN) with stronger and earlier accumulation in homozygous mice. Scale bar = 25 µm. (b) NeuN-positive neurons in the DCN (lateral, intermediate, and medial nuclei) are preserved in 24-week-old wt/Q84 and Q84/Q84 mice. Bars represent the mean neuronal density ± SEM of NeuN-positive cells (five sections per animal, three animals per group). (c) Absence of Purkinje neuronal loss in wt/Q84 and Q84/Q84 transgenic mice at 24 weeks. Bars represent the mean number ± SEM of Calbindin-positive cells in the primary fissure of single plane images (three sections per animal, three animals per group).
Figure 3
Figure 3
miRATXN3-mediated suppression of human ATXN3 expression in cerebellum of Q84/Q84 mice. (a) Diagram of the microRNA-like construct, miRATXN3, which targets a sequence in the 3′-untranslated region of human ATXN3 transcripts. (b) Schematic of the trial of viral-delivered miRATXN3 to the cerebellum of Q84/Q84 mice. (c) Experimental and control groups included in the trial. (d) Specific reduction of human ATXN3 mRNA in miRATXN3-injected Q84/Q84 cerebella, assessed by quantitative real-time reverse transcription-PCR (n = 3). ΔΔCT values of human and mouse ATXN3 transcripts were normalized to Gapdh mRNA levels and are shown as % fold-change relative to miRMis-treated cerebella (±SEM). *Statistical significance of P < 0.05. (e) Immunoblot for ATXN3 (1H9) shows reduced human mutant ATXN3 (ATXN3Q84) levels in cerebella of miRATXN3-treated Q84/Q84 mice compared with all control groups. Three mice (1–3) were analyzed per group, 10 weeks after viral injection. Relative viral transduction efficiency is suggested by hrGFP expression levels. (f) Quantification of immunoblots shown in e. Human ATXN3Q84 and endogenous murine Atxn3 bands were quantified by densitometry and normalized for Gapdh levels. Bars represent the average ATXN3 level (±SEM) relative to Q84/Q84 vehicle-infused mice. Statistical significance of *P < 0.05 and **P < 0.005 is indicated. (g) Immunohistochemistry with anti-ATXN3 antibody 1H9 reveals depletion of ATXN3-positive labeling in the deep cerebellar nuclei and cerebellar lobules of Q84/Q84 miRATXN3. Scale bar = 500 µm. AAV, adeno-associated virus; hrGFP, humanized Renilla green fluorescent protein.
Figure 4
Figure 4
Cerebellar neurons transduced with the AAV2/1-miRATXN3-hrGFP virus show depletion of ATXN3 10 weeks after delivery. (a) Confocal z-stack images of coronal sections of cerebellum show decreased ATXN3 labeling (1H9 antibody) in miRATXN3-transduced (GFP-positive) Purkinje cell layer and deep cerebellar nuclei (DCN) (arrows) compared with nontransduced (GFP-negative) areas or neurons transduced with AAV2/1-miRMis-hrGFP (arrowheads). Scale bar = 100 µm. (b) miRATXN3-treated Purkinje cells (arrows) show depletion of ATXN3 staining, in contrast to GFP-negative and control virus-transduced cells (arrowheads). Scale bar = 20 µm. (c) Similarly, miRATXN3-positive DCN neurons (arrows) show reduction levels of ATXN3 compared with controls (arrowheads). Scale bar = 20 µm.
Figure 5
Figure 5
Cerebellar delivery of adeno-associated virus 2/1-miRATXN3-hrGFP virus does not lead to signs of gliosis or inflammation 10 weeks after infusion. Confocal immunofluorescence images of cerebellum show similar levels of the (a) astrocytic marker GFAP and (b) the microglial marker Iba1 in viral-transduced areas of Q84/Q84 miRATXN3 and Q84/Q84 miRMis mice. *Iba1 staining is focally increased adjacent to injection sites. Scale bar = 100 µm.
Figure 6
Figure 6
Cerebellar viral delivery of miRATXN3 mimic is not neurotoxic 10 weeks postinjection. (a) Neuronal labeling (NeuN) shows similar patterns in the cerebella from Q84/Q84 miRATXN3 and Q84/Q84 miRMis mice. Scale bar = 100 µm. (b) Immunoblotting for NeuN shows similar levels in the cerebella of all infused Q84/Q84 groups. Three mice (1–3) were used per group. (c) Quantification of the immunoblots shown in b. NeuN bands were quantified by densitometry and normalized to Gapdh levels. Bars represent the average NeuN level (±SEM) relative to Q84/Q84 vehicle-infused mice. No statistical significance was found between groups. (d) Single-plane confocal micrographs of viral-transduced (GFP-positive) cerebellar lobules (primary fissure) immunostained for Calbindin show similar number of Purkinje neurons in miRATXN3-injected and miRMis-injected Q84/Q84 mice. Scale bar = 50 µm. (e) Purkinje cell count using images (exemplified in d) of three sections per mouse (three animals per group) reveals no significant differences between Q84/Q84 miRATXN3 and Q84/Q84 miRMis mice.
Figure 7
Figure 7
Longitudinal phenotypic evaluation shows similar results in miRATXN3-treated Q84/Q84 mice as in control mice. (a) All injected Q84/Q84 groups show decreased weight gain compared with wt/wt vehicle mice (note: nonlinear X axis). (b) Kaplan–Meier survival curves show similar survival rates in all groups of infused Q84/Q84 mice. (c) Similar early motor impairment in all Q84/Q84 mouse groups on 5-mm beam walking test, shown by increased latency traversing the beam compared with wt/wt vehicle control group (data points represent mean time to traverse the beam per trial/day/week ± SEM). (d) All Q84/Q84 groups show similar progressive hind limb dragging during the beam cross compared with wt/wt mice receiving vehicle (bars = frequency of dragging on day 4). (e) All groups of Q84/Q84 infused mice display decreased locomotor activity compared with wt/wt mice receiving vehicle (bars represent mean ± SEM). (f) Exploratory activity on open-field test is decreased in all Q84/Q84 mouse groups compared with wt/wt mice receiving vehicle (bars represent mean ± SEM). For d, *statistically significant difference between wt/wt vehicle mice and all Q84/Q84 mouse groups (P < 0.01). For c, e, and f, *statistically significant difference between wt/wt vehicle mice and all Q84/Q84 mouse groups using two-way analysis of variance repeated measures test (post hoc by Tukey test): (c) F4,64 = 11.150 for effect of injection, P < 0.001; (e) F5,70 = 11.755 for effect of injection, P < 0.001; (f) F5,70 = 8.779 for effect of injection, P < 0.001. No statistical difference was found between Q84/Q84 infused mouse groups for any motor function test. Mouse # per group: wt/wt vehicle, 11; Q84/Q84 vehicle, 21; Q84/Q84 miRATXN3, 19; Q84/Q84 miRMis, 16; and Q84/Q84 hrGFP, 17.
Figure 8
Figure 8
Viral-delivered miRATXN3 remains effective at reducing human ATXN3 until disease end stage. (a) Immunoblot for ATXN3 (1H9 antibody) shows ATXN3 depletion in whole cerebellum of Q84/Q84 mice receiving miRATXN3 mice at end of life compared with all control groups. Nine mice (1–9) were analyzed per group. Viral transduction efficiency per mouse is suggested by individual hrGFP expression levels. (b) Quantification of immunoblot shown in a. Human ATXN3Q84 and mouse Atxn3 were quantified by densitometry and normalized for Gapdh levels. Bars represent average ATXN3 levels (±SEM) relative to Q84/Q84 vehicle-infused mice. **Statistical significance of P < 0.005. (c) Confocal z-stack images of coronal sections of mouse cerebella at end stage showing decreased ATXN3 immunofluorescence (1H9 antibody) in miRATXN3-transduced (GFP-positive) cells in the deep cerebellar nuclei compared with cells transduced with adeno-associated virus 2/1 (AAV2/1)-miRMis-hrGFP. Scale bar = 20 µm. (d) No correlation was found between age-at-death and levels of human mutant ATXN3 in the cerebellum of Q84/Q84 mice. Black circles and white squares represent Q84/Q84 mice injected with vehicle or AAV2/1-miRATXN3-hrGFP, respectively. Pearson correlation R2 = 0.055, P = 0.359.

References

    1. Costa Mdo C, Paulson HL. Toward understanding Machado-Joseph disease. Prog Neurobiol. 2012;97:239–257. - PMC - PubMed
    1. Williams AJ, Paulson HL. Polyglutamine neurodegeneration: protein misfolding revisited. Trends Neurosci. 2008;31:521–528. - PMC - PubMed
    1. Lima M, Costa MC, Montiel R, Ferro A, Santos C, Silva C, et al. Population genetics of wild-type CAG repeats in the Machado-Joseph disease gene in Portugal. Hum Hered. 2005;60:156–163. - PubMed
    1. Maciel P, Costa MC, Ferro A, Rousseau M, Santos CS, Gaspar C, et al. Improvement in the molecular diagnosis of Machado-Joseph disease. Arch Neurol. 2001;58:1821–1827. - PubMed
    1. Coutinho P, Andrade C. Autosomal dominant system degeneration in Portuguese families of the Azores Islands. A new genetic disorder involving cerebellar, pyramidal, extrapyramidal and spinal cord motor functions. Neurology. 1978;28:703–709. - PubMed

Publication types

MeSH terms