. 2014 May;63(5):832-43.
doi: 10.1136/gutjnl-2012-304037. Epub 2013 Jun 13.

A disrupted RNA editing balance mediated by ADARs (Adenosine DeAminases that act on RNA) in human hepatocellular carcinoma

Affiliations
Free PMC article

A disrupted RNA editing balance mediated by ADARs (Adenosine DeAminases that act on RNA) in human hepatocellular carcinoma

Tim Hon Man Chan et al. Gut. 2014 May.
Free PMC article

Abstract

Objective: Hepatocellular carcinoma (HCC) is a heterogeneous tumour displaying a complex variety of genetic and epigenetic changes. In human cancers, aberrant post-transcriptional modifications, such as alternative splicing and RNA editing, may lead to tumour specific transcriptome diversity.

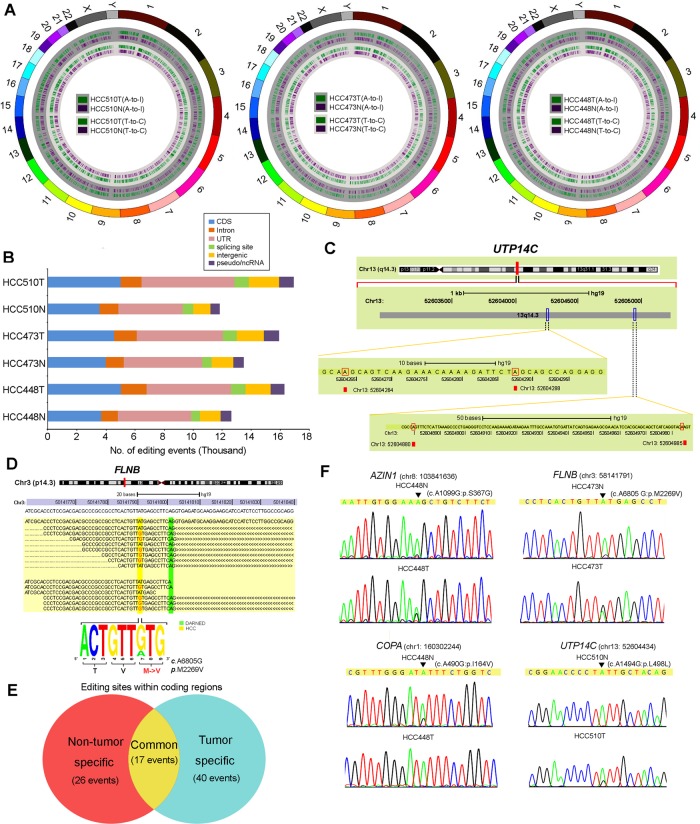
Design: By utilising large scale transcriptome sequencing of three paired HCC clinical specimens and their adjacent non-tumour (NT) tissue counterparts at depth, we discovered an average of 20 007 inferred A to I (adenosine to inosine) RNA editing events in transcripts. The roles of the double stranded RNA specific ADAR (Adenosine DeAminase that act on RNA) family members (ADARs) and the altered gene specific editing patterns were investigated in clinical specimens, cell models and mice.

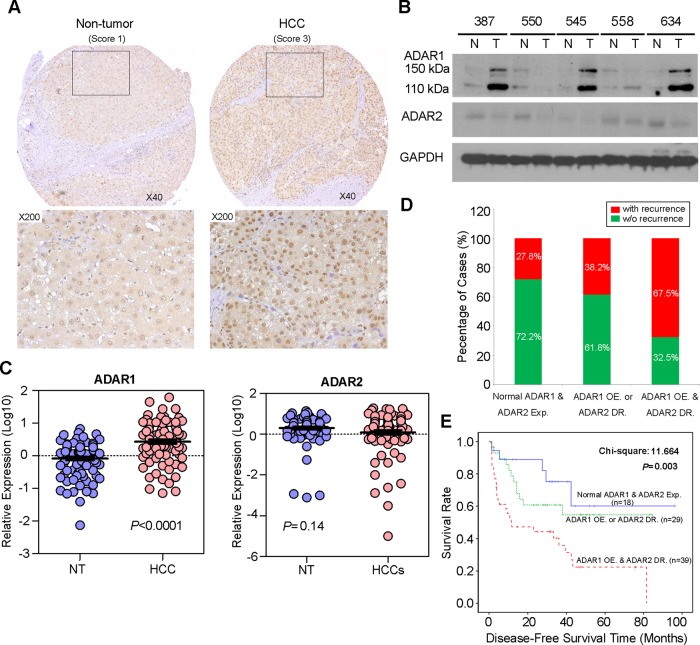
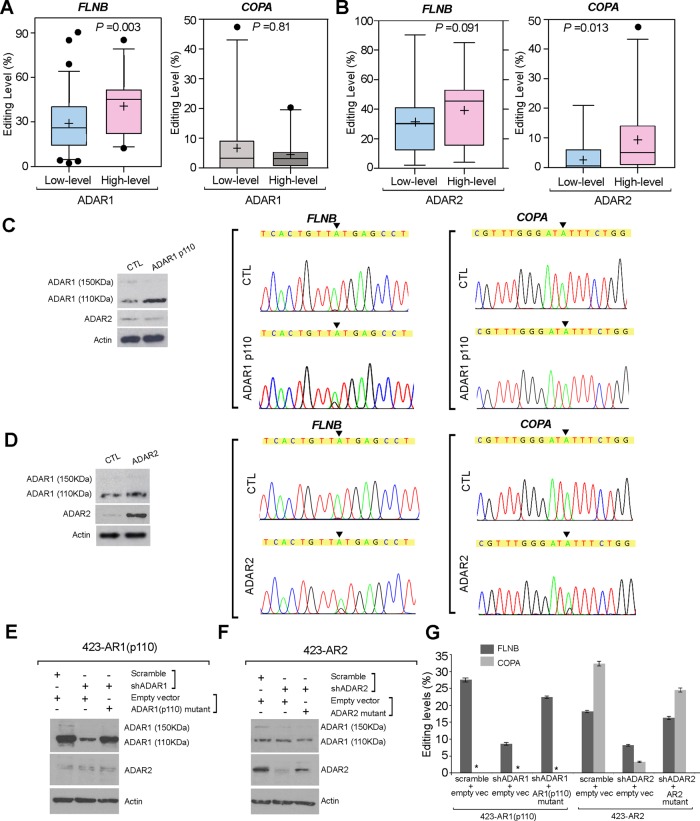
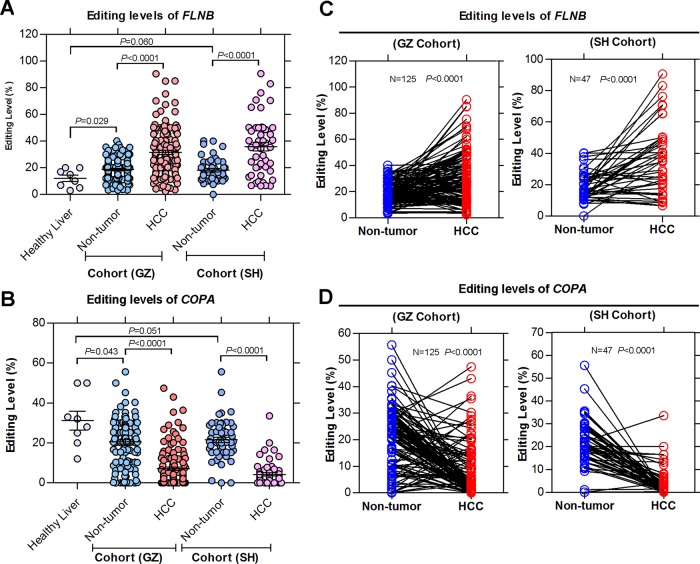
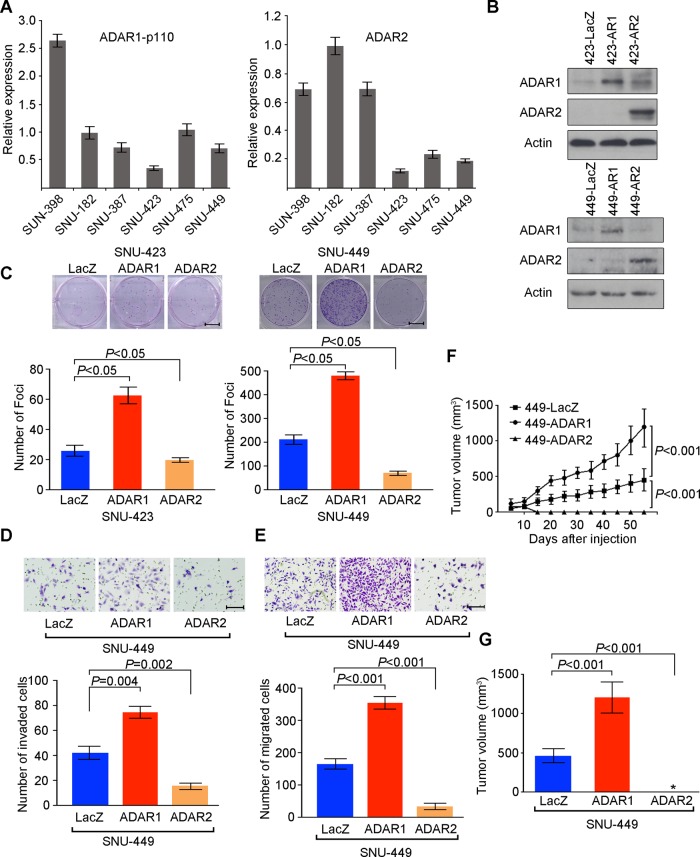
Results: HCC displays a severely disrupted A to I RNA editing balance. ADAR1 and ADAR2 manipulate the A to I imbalance of HCC via their differential expression in HCC compared with NT liver tissues. Patients with ADAR1 overexpression and ADAR2 downregulation in tumours demonstrated an increased risk of liver cirrhosis and postoperative recurrence and had poor prognoses. Due to the differentially expressed ADAR1 and ADAR2 in tumours, the altered gene specific editing activities, which was reflected by the hyper-editing of FLNB (filamin B, β) and the hypo-editing of COPA (coatomer protein complex, subunit α), are closely associated with HCC pathogenesis. In vitro and in vivo functional assays prove that ADAR1 functions as an oncogene while ADAR2 has tumour suppressive ability in HCC.

Conclusions: These findings highlight the fact that the differentially expressed ADARs in tumours, which are responsible for an A to I editing imbalance, has great prognostic value and diagnostic potential for HCC.

Keywords: Cancer; Gene Expression; Gene Regulation; Molecular Carcinogenesis; Molecular Pathology.


Figures

Figure 1
Figure 1
Global identification of potential A to I (G) editing sites by RNA sequencing (RNA-Seq). (A) Distribution of potential editing sites across all of the chromosomes (shown by exterior circle) in three paired hepatocellular carcinoma (HCC) and matched non-tumour (NT) liver samples (HCC448N/T, HCC473N/T and HCC510N/T). The green and purple blocks in the inner circles (deep gray) indicate the A to G substitutions in the tumour and matched NT liver samples, respectively. The green and purple blocks in the inner circle (light gray) indicate the T to C substitutions in the tumour and matched NT liver samples, respectively. UTR, untranslated region. (B) Number of editing sites distributed in each functional category. (C) One example of the UTP14C gene with multiple edits. The RNA editing sites identified from the RNA-Seq data are highlighted by the red boxes. (D) Sequences of individual reads were aligned to the published human genomic sequence of the FLNB (filamin B, β) gene. An A to G conversion was found in the HCC473T sample. The editing and reference events are highlighted by yellow shading. The green boxes denote the editing site reported by DARNED. A sequence logo representation of the editing event in the tumour sample is shown below. The height of each letter is proportional to its frequency. (E) Venn diagram illustrating the numbers of exonic editing events which were classified into the three indicated categories. (F) Sequence chromatograms of the AZIN1, FLNB, COPA and UTP14C transcripts in the indicated tumour and matched NT liver samples. An arrow indicates the editing position. The sequence chromatograms of the matching genomic DNA (gDNA) sequences of each gene are shown in online supplementary figure S2.
Figure 2
Figure 2
Differential expression of ADAR (Adenosine DeAminase that acts on RNA) 1 and ADAR2 in hepatocellular carcinoma (HCC) and its clinical implication. (A) Example of ADAR1 expression level detected in a primary HCC tumour and its matched non-tumour (NT) liver specimen. Based on staining intensities, ADAR1 immunoreactivities were scored as strong expression (3) and weak (1) expression in the primary HCC and matched NT liver specimens, respectively (see the online supplementary materials and methods section for details). The boxed regions are magnified and displayed in the lower panels. (B) Western blot analyses of ADAR1 and ADAR2 expression levels in five paired HCC and matched NT liver specimens. Glyceraldehyde 3-phosphate dehydrogenase (GAPDH) was used as a loading control. (C) Dot plots represent relative ADAR1 (left) and ADAR2 (right) expression levels in HCC and corresponding NT liver tissue samples, as detected by quantitative real time PCR (mean±SD, n=92; Mann–Whitney U test). (D) Association between the postoperative recurrence rate and status of expression of ADARs (p=0.004, χ2 test). (E) Kaplan–Meier plots for disease free survival rate of patients demonstrating ADAR1 overexpression (OE) and ADAR2 downregulation (DR) (red line; n=39), ADAR1 OE or ADAR2 DR (green line; n=44) and normal ADAR1 and ADAR2 expression in tumours (blue line; n=23) (log rank test).
Figure 3
Figure 3
FLNB (filamin B, β) editing is catalysed by both ADAR (Adenosine DeAminase that acts on RNA) 1 and ADAR2, while COPA (coatomer protein complex, subunit α) editing is specifically catalysed by ADAR2. (A, B) FLNB and COPA editing level in tumours with ‘high level’ and ‘low level’ expression of ADAR1 (A) or ADAR2 (B). The data are presented as box plots with median (horizontal line), 25–75% (box) and 5–95% (error bar) percentiles for each group. The mean is indicated as ‘+’ (Mann–Whitney U test) and the dots indicate the outliers. (C, D) Left: Western blot analyses of ADAR1 and ADAR2 expression in SNU-423 cells that were transiently transfected with an ADAR1 p110 variant expression construct (ADAR1 p110) or empty vector (CTL) (C) or SNU-423 cells that were transiently transfected with an ADAR2 expression construct (ADAR2) or empty vector (CTL) (D). (C, D) Right: sequence chromatograms of the FLNB and COPA transcripts in the indicated cell lines. The percentages of edited FLNB or COPA transcripts were detected as described in the Materials and Methods section. An arrow indicates the editing position. (E, F) Following transfection with the indicated constructs into SNU-423 cells that stably expressed the ADAR1 p110 isoform (E) or ADAR2 (F) (see the online supplementary materials and methods section for details), ADAR1 and ADAR2 expression levels were detected by western blot analysis. (G) Editing levels of FLNB and COPA in each cell line as indicated are shown in a bar chart (mean±SD of three independent experiments; *undetectable).
Figure 4
Figure 4
Altered gene specific editing patterns induced by the differentially expressed ADARs (Adenosine DeAminases that act on RNA) is closely associated with hepatocellular carcinoma (HCC) pathogenesis. (A, B) Dot plots represent FLNB (filamin B, β) (A) and COPA (coatomer protein complex, subunit α) (B) editing levels in healthy human liver tissues (mean±SD, n=8) and in 125 matched primary HCC and non-tumour (NT) liver samples in the Guangzhou (GZ) cohort and in 47 matched primary HCC and NT liver samples in the Shanghai (SH) cohort (Mann–Whitney U test). (C, D) FLNB (C) and COPA (D) editing levels in HCC and matched NT liver specimens from 125 and 47 patients in the GZ and SH cohorts (paired Student's t test).
Figure 5
Figure 5
ADAR1 (Adenosine DeAminase that acts on RNA 1) has oncogenic ability while ADAR2 functions as a tumour suppressor gene. (A) Relative ADAR1 p110 and ADAR2 expression levels in six hepatocellular carcinoma cell lines, as detected by quantitative real time PCR (mean±SD of three independent experiments). (B) Western blotting showing expression of ADAR1 p110 and ADAR2 proteins in the indicated cell lines. β-Actin was the loading control. (C) Quantification of foci formation induced by the indicated stable cell lines. Triplicate independent experiments were performed and the data were expressed as the mean±SD of triplicate wells within the same experiment (unpaired two tailed Student's t test). Scale bar 1 cm. (D, E) Quantification of cells from the indicated cells that invaded through the Matrigel coated membrane (D) or migrated through the polyethylene terephthalate membrane (E) (unpaired two tailed Student's t test). Scale bar 200 μm. (F) Growth curves of tumours derived from the indicated cell lines over a period of 8 weeks. Data are presented as mean±SD (unpaired two tailed Student's t test). (G) Volumes of tumours derived from the indicated cell lines at the end point. Data are presented as mean±SD (unpaired two tailed Student's t test). *undetectable.

Comment in

  • Editing liver tumours.
    Colnot S, Fortes P. Colnot S, et al. Gut. 2014 May;63(5):709-10. doi: 10.1136/gutjnl-2013-305334. Epub 2013 Jul 22. Gut. 2014. PMID: 23878166 No abstract available.

References

    1. Blow M, Futreal PA, Wooster R, et al. A survey of RNA editing in human brain. Genome Res 2004;14:2379–87 - PMC - PubMed
    1. Athanasiadis A, Rich A, Maas S. Widespread A-to-I RNA editing of Alu-containing mRNAs in the human transcriptome. PLoS Biol 2004;2:e391. - PMC - PubMed
    1. Maas S, Kawahara Y, Tamburro KM, et al. A-to-I RNA editing and human disease. RNA Biol 2006;3:1–9 - PMC - PubMed
    1. Li JB, Levanon EY, Yoon JK, et al. Genome-wide identification of human RNA editing sites by parallel DNA capturing and sequencing. Science 2009;324:1210–13 - PubMed
    1. Parkin DM, Bray F, Ferlay J, et al. Global cancer statistics, 2002. CA Cancer J Clin 2005;55:74–108 - PubMed

Publication types

MeSH terms

Associated data