. 2013 Jun;7(3):160-5.
doi: 10.4162/nrp.2013.7.3.160. Epub 2013 Jun 3.

Peanut sprout ethanol extract inhibits the adipocyte proliferation, differentiation, and matrix metalloproteinases activities in mouse fibroblast 3T3-L1 preadipocytes

Affiliations

Peanut sprout ethanol extract inhibits the adipocyte proliferation, differentiation, and matrix metalloproteinases activities in mouse fibroblast 3T3-L1 preadipocytes

Woo Kyoung Kim et al. Nutr Res Pract. 2013 Jun.

Abstract

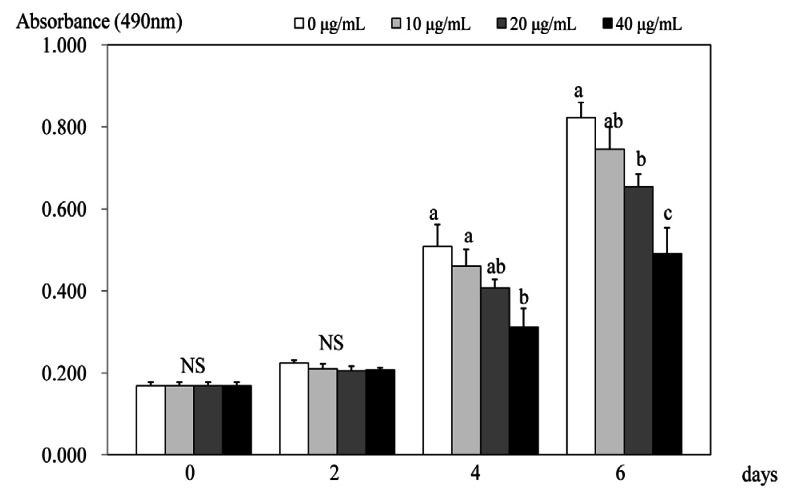
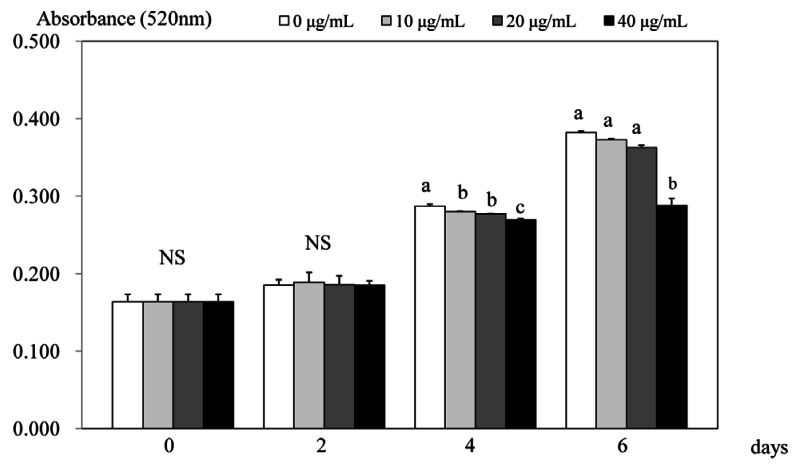
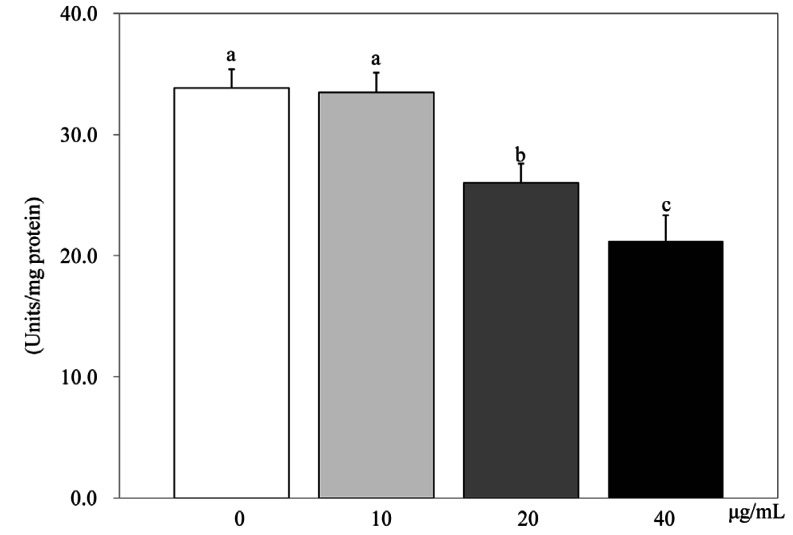
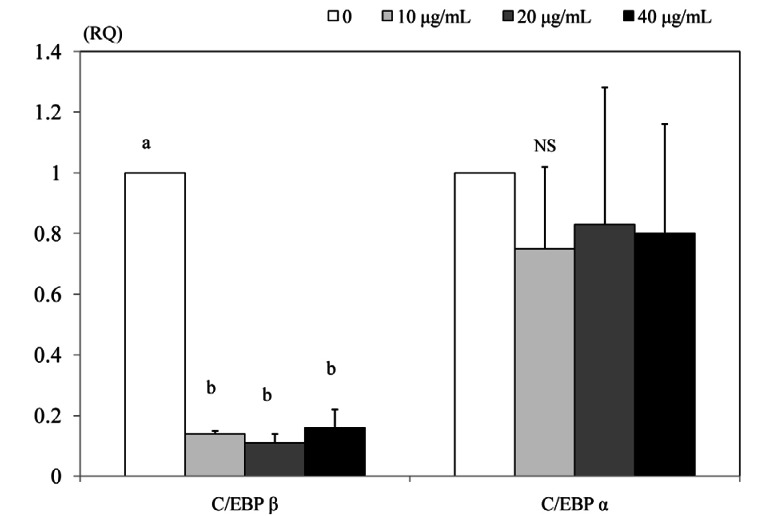
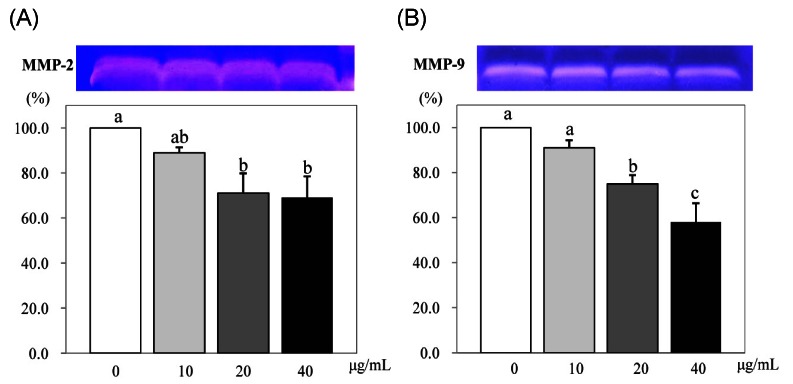
3T3-L1 preadipocyte were differentiated to adipocytes, and then treated with 0, 10, 20, and 40 µg/mL of peanut sprout ethanol extract (PSEE). The main component of PSEE is resveratrol which contained 5.55 mg/mL of resveratrol. The MTT assay, Oil-Red O staining, glycerol-3-phosphate dehydrogenase (GPDH) activity, and the triglyceride concentration were determined in 3T3-L1 cells. MMP-2 and MMP-9 activities as well as mRNA expressions of C/EBP β and C/EBP α were also investigated. As the concentration of PSEE in adipocytes increased, the cell proliferation was decreased in a dose-dependent manner from 4 days of incubation (P < 0.05). The GDPH activity (P < 0.05) and the triglyceride concentration (P < 0.05) were decreased as the PSEE treatment concentration increased. The mRNA expression of C/EBPβ in 3T3-L1 cells was significantly low in groups of PSEE-treated, compared with control group (P < 0.05). The MMP-9 (P < 0.05) and MMP-2 (P < 0.05) activities were decreased in a dose-dependent manner as the PSEE concentration increased from 20 µg/mL. In conclusion, it was found that PSEE has an effect on restricting proliferation and differentiation of adipocytes.

Keywords: Peanut sprout extract; adipocytes; glycerol-3-phosphate dehydrogenase; matrix metalloproteinases; resveratrol.


Figures

Fig. 1
Fig. 1
Effect of PSEE on cell growth in 3T3-L1 cells. 3T3-L1 cells were plated at a density of 1.5 × 10⁴ cells/mL in 24 well plate with DMEM, supplemented with 10% FBS, 10 µg/mL insulin, 1 µmol/L Dex, and 0.5 mmol/L IBMX for 2 days. After differentiation induction, the monolayer was incubated in post-differentiation medium with 0, 10, 20, or 40 µg/mL PSEE. Viable cell numbers were estimated by the MTT assay. Each bar represents the mean ± SE. Comparison among different concentrations of PSEE that yielded significant differences (P < 0.05) are indicated by different letters above each bar.
Fig. 2
Fig. 2
Effect of PSEE on quantification of lipid content in 3T3-L1 cells. 3T3-L1 cells were plated at a density of 1.5 × 10⁴ cells/mL in 24 well plate with DMEM supplemented with 10% FBS, 10 µg/mL insulin, 1 µmol/L Dex, and 0.5 mmol/L IBMX for 2 days. After differentiation induction, the monolayer was incubated in post-differentiation medium with 0, 10, 20, or 40 µg/mL PSEE. Lipid accumulation was estimated by the Oil-Red O staining. Each bar represents the mean ± SE. Comparison among different concentrations of PSEE that yielded significant differences (P < 0.05) are indicated by different letters above each bar.
Fig. 3
Fig. 3
Effect of PSEE on triglyceride in 3T3-L1 cells. 3T3-L1 cells were plated at a density of 1.5 × 10⁴ cells/mL in 24 well plate with DMEM supplemented with 10% FBS, 10 µg/mL insulin, 1 µmol/L Dex, and 0.5 mmol/L IBMX for 2 days. After differentiation induction, the monolayer was incubated in post-differentiation medium with 0, 10, 20, or 40 µg/mL PSEE. Triglyceride accumulation was estimated by the commercial triglyceride assay kit. Each bar represents the mean ± SE. Comparison among different concentrations of PSEE that yielded significant differences (P < 0.05) are indicated by different letters above each bar.
Fig. 4
Fig. 4
Effect of PSEE on GPDH activity in 3T3-L1 cells. 3T3-L1 cells were plated at a density of 1.5 × 10⁴ cells/mL in 24 well plate with DMEM supplemented with 10% FBS, 10 µg/mL insulin, 1 µmol/L Dex, and 0.5 mmol/L IBMX for 2 days. After differentiation induction, the monolayer was incubated in post-differentiation medium with 0, 10, 20, or 40 µg/mL PSEE. GPDH activity were estimated by commercial GPDH activity assay kit. Each bar represents the mean ± SE. Comparison among different concentrations of PSEE that yielded significant differences (P < 0.05) are indicated by different letters above each bar.
Fig. 5
Fig. 5
Effect of PSEE on mRNA expression of transcription factors in 3T3-L1 cells. 3T3-L1 cells were plated at a density of 1.5 × 10⁴ cells/mL in 24 well plate with DMEM supplemented with 10% FBS, 10 µg/mL insulin, 1 µmol/L Dex, and 0.5 mmol/L IBMX for 2 days. After differentiation induction, the monolayer was incubated in post-differentiation medium with 0, 10, 20, or 40 µg/mL PSEE. Chemiluminescent detection and quantitative analysis of western blots were performed for three independent experiments. The protein expression of C/EBP β (left) and C/EBP α (right) are shown above. Each bar represents the mean ± SE. Comparison among different concentrations of PSEE that yielded significant differences (P < 0.05) are indicated by different letters above each bar.
Fig. 6
Fig. 6
Effect of PSEE on MMPs activity in 3T3-L1 cells. 3T3-L1 cells were plated at a density of 1.5 × 10⁴ cells/mL in 24 well plate with DMEM supplemented with 10% FBS, 10 µg/mL insulin, 1 µmol/L Dex, and 0.5 mmol/L IBMX for 2 days. After differentiation induction, the monolayer was incubated in post-differentiation medium with 0, 10, 20, or 40 µg/mL PSEE. Medium were collected and concentrated for zymography. Above photograph of MMPs bands, which were representative of three independent experiments, are shown. Under bars were quantitative analyses of zymography. Each bar represents the mean ± SE. Comparison among different concentrations of PSEE that yielded significant differences (P < 0.05) are indicated by different letters above each bar.

References

    1. Cornelius P, MacDougald OA, Lane MD. Regulation of adipocyte development. Annu Rev Nutr. 1994;14:99–129. - PubMed
    1. Camp HS, Ren D, Leff T. Adipogenesis and fat-cell function in obesity and diabetes. Trends Mol Med. 2002;8:442–447. - PubMed
    1. Rosen ED, Walkey CJ, Puigserver P, Spiegelman BM. Transcriptional regulation of adipogenesis. Genes Dev. 2000;14:1293–1307. - PubMed
    1. Bouloumié A, Sengenès C, Portolan G, Galitzky J, Lafontan M. Adipocyte produces matrix metalloproteinases 2 and 9: involvement in adipose differentiation. Diabetes. 2001;50:2080–2086. - PubMed
    1. Bhat KP, Pezzuto JM. Cancer chemopreventive activity of resveratrol. Ann N Y Acad Sci. 2002;957:210–229. - PubMed