. 2013:2013:359021.
doi: 10.1155/2013/359021. Epub 2013 May 12.

Clinical usefulness of response profiles to rapidly incremental cardiopulmonary exercise testing

Affiliations

Clinical usefulness of response profiles to rapidly incremental cardiopulmonary exercise testing

Roberta P Ramos et al. Pulm Med. 2013.

Abstract

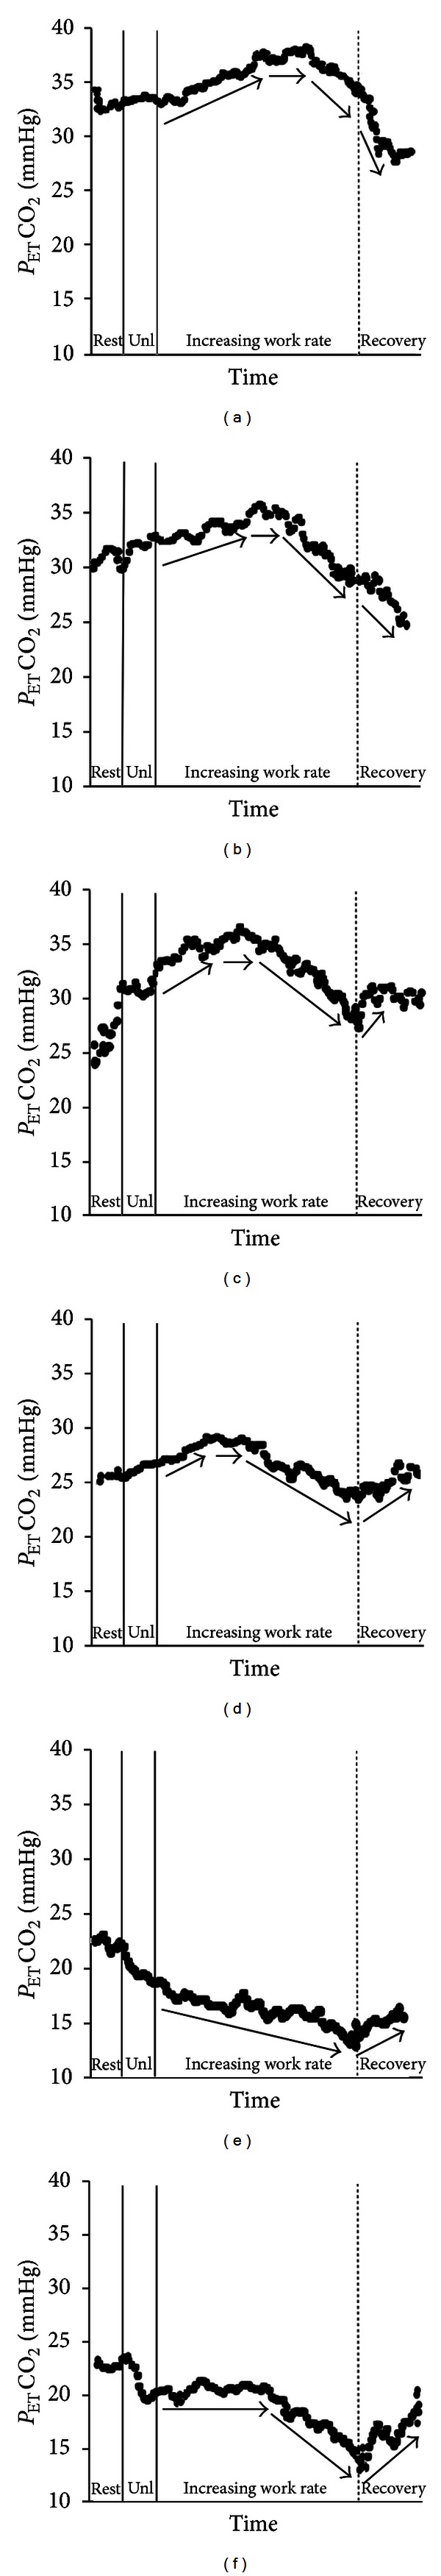
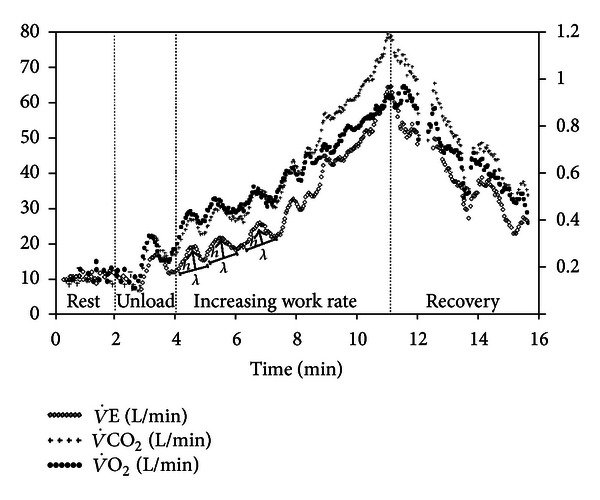
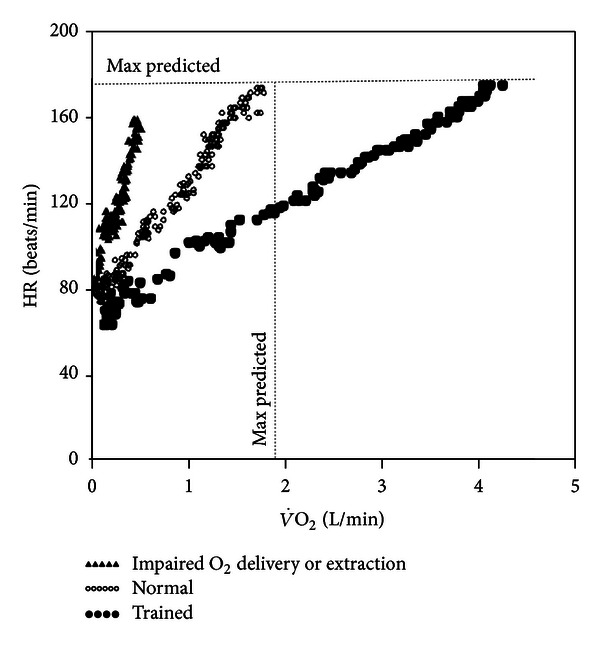
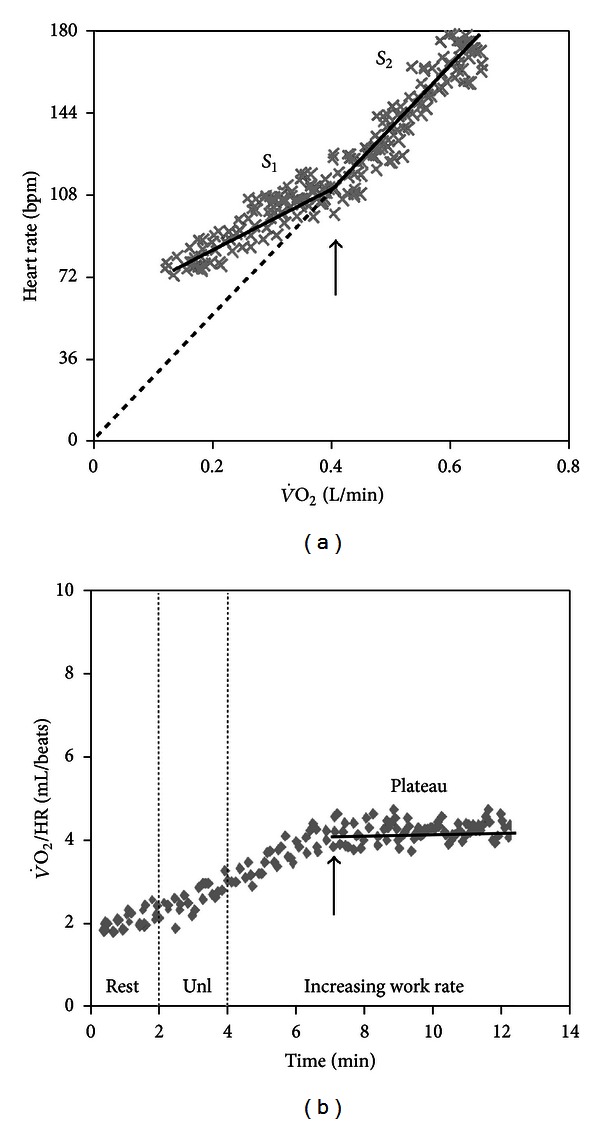
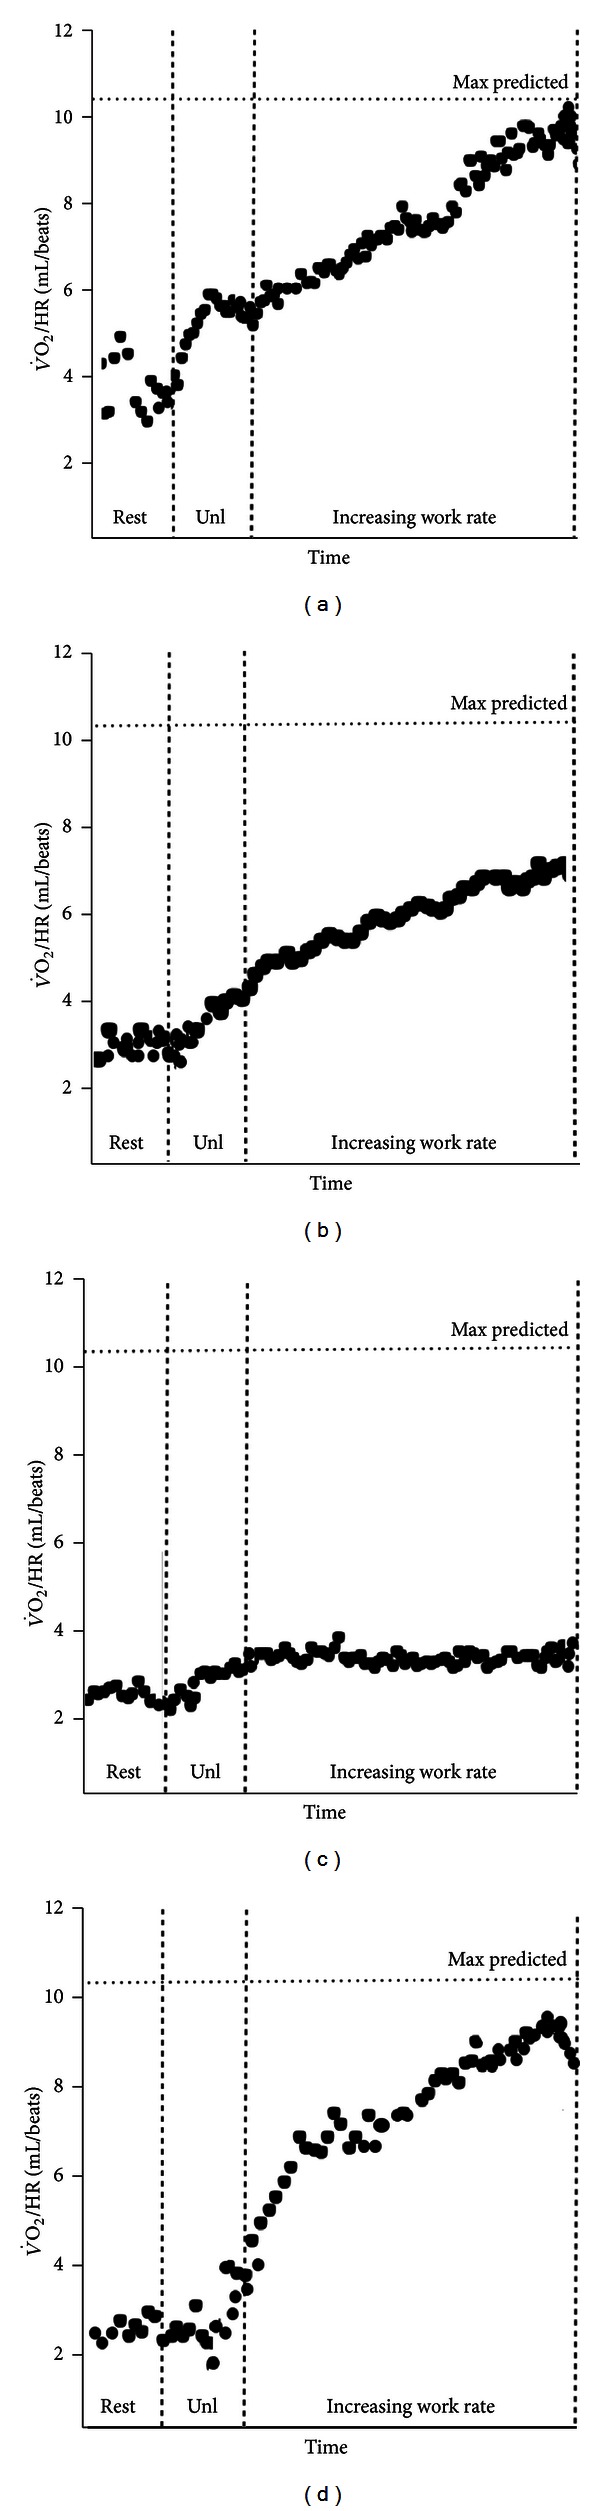
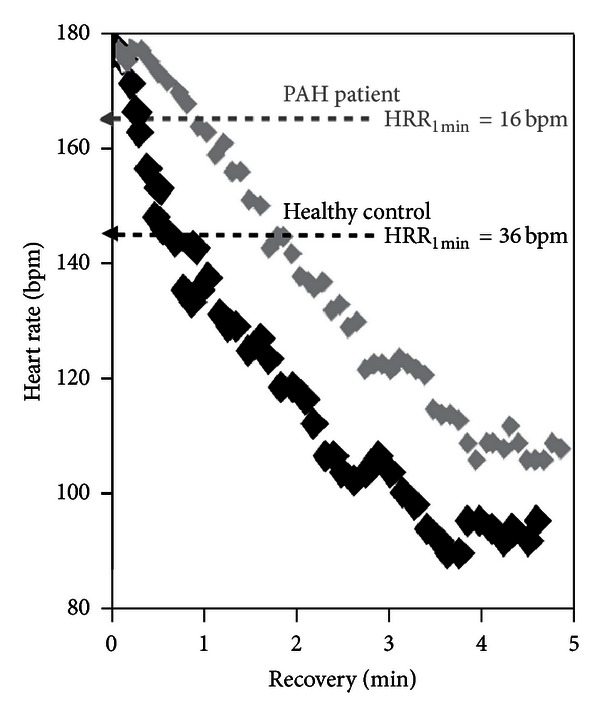
The advent of microprocessed "metabolic carts" and rapidly incremental protocols greatly expanded the clinical applications of cardiopulmonary exercise testing (CPET). The response normalcy to CPET is more commonly appreciated at discrete time points, for example, at the estimated lactate threshold and at peak exercise. Analysis of the response profiles of cardiopulmonary responses at submaximal exercise and recovery, however, might show abnormal physiologic functioning which would not be otherwise unraveled. Although this approach has long been advocated as a key element of the investigational strategy, it remains largely neglected in practice. The purpose of this paper, therefore, is to highlight the usefulness of selected submaximal metabolic, ventilatory, and cardiovascular variables in different clinical scenarios and patient populations. Special care is taken to physiologically justify their use to answer pertinent clinical questions and to the technical aspects that should be observed to improve responses' reproducibility and reliability. The most recent evidence in favor of (and against) these variables for diagnosis, impairment evaluation, and prognosis in systemic diseases is also critically discussed.


Figures

Figure 1
Figure 1
Noninvasive estimation of the lactate threshold by the V-slope method (gas exchange threshold (GET), panel (a)) and the ventilatory method (ventilatory threshold (VT), panel (b)) in a normal subject. Note that the GET slightly precedes the VT as the later depends on the ventilatory response to the “extra-CO2” generated by buffering of H+ associated with (lactate) increase. S 1 and S 2 refer to the two sequential slopes (before and after the GET) with S 2 being characteristically steeper than S 1 (i.e., slope inclination >1.)
Figure 2
Figure 2
Procedures to establish 3 dynamic submaximal relationships by simple linear regression during incremental CPET in young (24-yr-old, left panels) and old (70-yr-old, right panels) subjects. (a) Δ oxygen uptake (V˙O2)/Δ work rate (WR); (b) Δ heart rate/ΔV˙O2 (c) Δ minute ventilation (V˙E)/Δ carbon dioxide output (V˙CO2). The arrows show the range of values considered for analysis. RCP is the respiratory compensation point. (Modified with permission from [10].)
Figure 3
Figure 3
The submaximal relationships depicted in Figure 2 as a function of age in males (left panels) and females (right panels). Regression lines are shown with their respective 95% confidence intervals for those relationships in which the variables were influenced by age. Regression coefficients and intercepts of the linear prediction equations are depicted with their respective standard error of the estimate (SEE). (Modified with permission from [10]).
Figure 4
Figure 4
Oxygen uptake (V˙O2)/work rate (WR) relationship during ramp-incremental CPET before and after pulmonary endarterectomy in a 21-year-old male with thromboembolic occlusion of the left pulmonary artery. Note that after the surgery, peak V˙O2 increased not only due to a higher peak WR but also owing to a large improvement in ΔV˙O2/ΔWR.
Figure 5
Figure 5
Relationship between oxygen uptake (V˙O2) and minute ventilation (V˙E) during incremental exercise in a healthy subject (∙∙∙∙) and patients with mild (xxxx) and severe (▲▲▲▲) CHF. (a) The slope of V˙O2 upon log10V˙E is the oxygen uptake efficiency slope (OUES) which gives the rate of increase in V˙O2 for a 10-fold rise in   V˙E. (b) The highest V˙O2/V˙E ratio is the V˙O2 efficiency slope (OUEP) which is the average of values just prior to the estimated lactate threshold. Unl is unloaded pedaling.
Figure 6
Figure 6
Incremental cycle ergometer exercise tests in the same patient of Figure 4 with chronic thromboembolic pulmonary hypertension. After pulmonary endarterectomy (closed symbols), haemodynamic improvement (panel (a)) led to a higher oxygen uptake (V˙O2) at peak exercise and a faster (lower half-time (t 1/2) post-exercise decrease in V˙O2 (panel (b)). Cardiac output was noninvasively estimated by impedance cardiography and the tests were time-aligned by total exercise duration. Unl is unloaded pedaling.
Figure 7
Figure 7
(a) Minute ventilation (V˙E)/carbon dioxide output (V˙CO2) relationship from the beginning of exercise to the respiratory compensation point (solid line) or up to peak exercise (dashed line) in a patient with CHF. Note that ΔV˙E/ΔV˙CO2(rest-PEAK) is steeper than ΔV˙E/ΔV˙CO2(rest-RCP) because it adds a component of hyperventilation to lactic acidosis and/or other stimuli after the respiratory compensation point. (b) ΔV˙E/ΔV˙CO2 as a function of disease severity in pulmonary arterial hypertension (PAH). Higher values, however, are usually found in chronic thromboembolic pulmonary hypertension (CTEPH) due to pronounced increases in tidal volume ratio.
Figure 8
Figure 8
Exercise-induced right-to-left shunt as suggested by sudden decrease in oxyhemoglobin saturation by pulse oximetry (SpO2) and abrupt increases in the ventilatory equivalents for CO2 and O2 (V˙E/V˙CO2 and   V˙E/V˙O2) associated with a sustained decrease in the end-tidal partial pressure for CO2 (P ETCO2) with a concomitant increase in P ETO2 in a patient with pulmonary arterial hypertension. Shunting of systemic venous blood in the arterial circulation stimulated the peripheral chemoreceptors thereby leading to this pattern of ventilatory and gas exchange responses. Unl is unloaded pedaling.
Figure 9
Figure 9
Time course of end-tidal partial pressure for carbon dioxide (P ETCO2) during incremental exercise and early recovery in a healthy control (panel (a)) and five patients with pulmonary arterial hypertension of progressing severity (panels (b) to (f)). Note that P ETCO2 becomes lower and even fails to increase as disease progresses. Moreover, it frequently increases (instead of diminishing) during recovery. Panel (f), in particular, depicts a severely impaired patient showing abrupt and sustained decrease in P ETCO2 concomitant with the opening of a forame ovale (Figure 8). Unl is unloaded pedaling.
Figure 10
Figure 10
Exertional oscillatory ventilation (EOV) during incremental CPET in a 56-yr-old male with severe CHF. EOV was defined by regular (standard deviation of three consecutive cycle lenghts (λ) within 20% of their average) and ample (minimal h of 5 L/min) cycles of ventilatory (V˙E) oscillations [27]. A similar oscillatory pattern is also seen in oxygen uptake (V˙O2) and carbon dioxide output (V˙CO2).
Figure 11
Figure 11
Heart rate (HR) response as a function of O2 uptake (V˙O2) in 3 males of same age: a patient with abnormal O2 delivery and/or extraction (severe pulmonary arterial hypertension, ΔHR/ΔV˙O2 = 158  beats/L), a normal sedentary subject (ΔHR/ΔV˙O2 = 65  beats/L), and a triathlete (ΔHR/ΔV˙O2 = 26  beats/L).
Figure 12
Figure 12
Change in Δ heart rate (HR)/Δ oxygen uptake (V˙O2) (arrow) slope (arrow) during incremental CPET in a patient with severe cardiovascular limitation to exercise (panel (a)). Note that this led to a plateau in O2 pulse (V˙O2/HR ratio) as the y-intercept becomes zero; that is, the relationship passes through its origin (panel (b)). Unl is unloaded pedaling.
Figure 13
Figure 13
O2 pulse (V˙O2/HR) as a function of time during incremental exercise. (a) Curvilinear increase up to a normal predicted value in a healthy subject; (b) abnormally low peak values due to ventilatory limitation and early exercise cessation in a patient wirh COPD; (c) failure to increase and early plateau in a patient with end-stage pulmonary arterial hypertension; (d) decrease at near maximum exercise in a patients with concomitant electrocardiographic abnormalities indicative of coronary artery disease. Unl is unloaded pedaling.
Figure 14
Figure 14
Heart rate (HR) response after incremental exercise in a healthy control and a patient with pulmonary arterial hypertension (PAH) of same age and gender (both females aged 31). Note the delayed HR recovery (HRR) up to the 5th minute after-exercise in the patient compared to the control. HRR1 min ≤ 18 bpm after cycle ergometer exercise test has recently been found an independent predictor of mortality in these patients [28].

References

    1. Wasserman K, Whipp BJ. Exercise physiology in health and disease. The American Review of Respiratory Disease. 1975;112(2):219–249. - PubMed
    1. Wasserman K, Hansen JE, Sue DY, et al. Principles of Exercise Testing and Interpretation. 5th edition. Philadelphia, Pa, USA: Lippincott Williams & Wilkins; 2012.
    1. Beaver WL, Wasserman K, Whipp BJ. On-line computer analysis and breath-by-breath graphical display of exercise function tests. Journal of Applied Physiology. 1973;34(1):128–132. - PubMed
    1. Whipp BJ, Davis JA, Torres F, Wasserman K. A test to determine parameters of aerobic function during exercise. Journal of Applied Physiology Respiratory Environmental and Exercise Physiology. 1981;50(1):217–221. - PubMed
    1. Buchfuhrer MJ, Hansen JE, Robinson TE, et al. Optimizing the exercise protocol for cardiopulmonary assessment. Journal of Applied Physiology Respiratory Environmental and Exercise Physiology. 1983;55(5):1558–1564. - PubMed

LinkOut - more resources