

Profiling of normal and malignant breast tissue show CD44high/CD24low phenotype as a predominant stem/progenitor marker when used in combination with Ep-CAM/CD49f markers
- PMID: 23768049
- PMCID: PMC3702414
- DOI: 10.1186/1471-2407-13-289
Profiling of normal and malignant breast tissue show CD44high/CD24low phenotype as a predominant stem/progenitor marker when used in combination with Ep-CAM/CD49f markers
Abstract
Background: Accumulating evidence supports cancer to initiate and develop from a small population of stem-like cells termed as cancer stem cells (CSC). The exact phenotype of CSC and their counterparts in normal mammary gland is not well characterized. In this study our aim was to evaluate the phenotype and function of stem/progenitor cells in normal mammary epithelial cell populations and their malignant counterparts.
Methods: Freshly isolated cells from both normal and malignant human breasts were sorted using 13 widely used stem/progenitor cell markers individually or in combination by multi-parametric (up to 9 colors) cell sorting. The sorted populations were functionally evaluated by their ability to form colonies and mammospheres, in vitro.
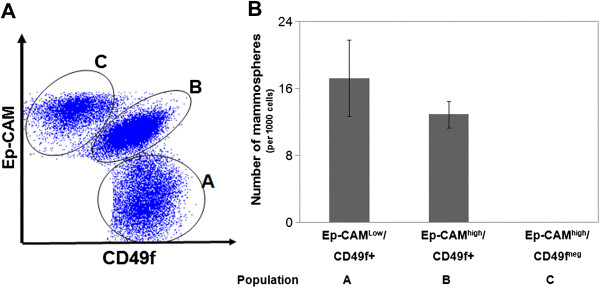
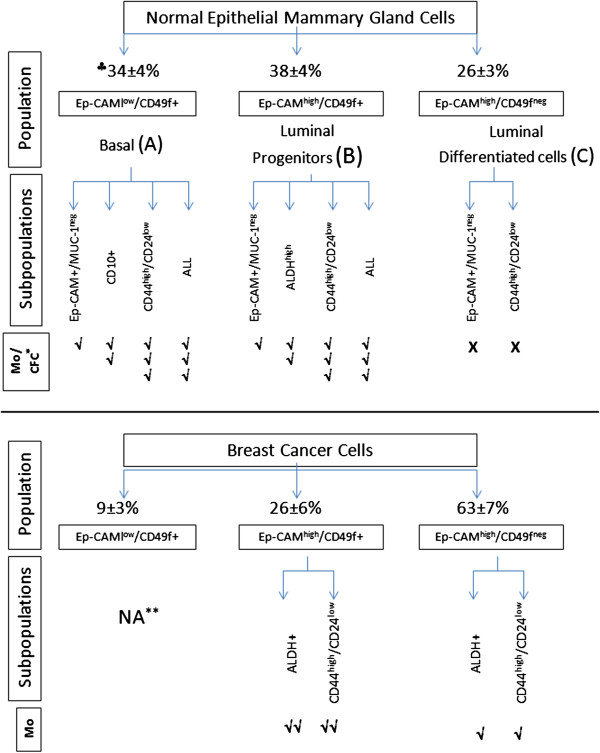
Results: We have compared, for the first time, the stem/progenitor markers of normal and malignant breasts side-by-side. Amongst all markers tested, we found CD44high/CD24low cell surface marker combination to be the most efficient at selecting normal epithelial progenitors. Further fractionation of CD44high/CD24low positive cells showed that this phenotype selects for luminal progenitors within Ep-CAMhigh/CD49f + cells, and enriches for basal progenitors within Ep-CAM-/low/CD49f + cells. On the other hand, primary breast cancer samples, which were mainly luminal Ep-CAMhigh, had CD44high/CD24low cells among both CD49fneg and CD49f + cancer cell fractions. However, functionally, CSC were predominantly CD49f + proposing the use of CD44high/CD24low in combination with Ep-CAM/CD49f cell surface markers to further enrich for CSC.
Conclusion: Our study clearly demonstrates that both normal and malignant breast cells with the CD44high/CD24low phenotype have the highest stem/progenitor cell ability when used in combination with Ep-CAM/CD49f reference markers. We believe that this extensive characterization study will help in understanding breast cancer carcinogenesis, heterogeneity and drug resistance.
Figures


Similar articles
-
Novel measurements of mammary stem cells in human umbilical cord blood as prospective predictors of breast cancer susceptibility in later life.Ann Oncol. 2012 Jan;23(1):245-250. doi: 10.1093/annonc/mdr153. Epub 2011 Apr 22. Ann Oncol. 2012. PMID: 21515664 Free PMC article.
-
Mapping the cellular and molecular heterogeneity of normal and malignant breast tissues and cultured cell lines.Breast Cancer Res. 2010;12(5):R87. doi: 10.1186/bcr2755. Epub 2010 Oct 21. Breast Cancer Res. 2010. PMID: 20964822 Free PMC article.
-
P-cadherin is coexpressed with CD44 and CD49f and mediates stem cell properties in basal-like breast cancer.Stem Cells. 2012 May;30(5):854-64. doi: 10.1002/stem.1075. Stem Cells. 2012. PMID: 22389315
-
Understanding breast cancer stem cell heterogeneity: time to move on to a new research paradigm.BMC Med. 2013 Jul 23;11:169. doi: 10.1186/1741-7015-11-169. BMC Med. 2013. PMID: 23879988 Free PMC article. Review.
-
Breast cancer stem cells and intrinsic subtypes: controversies rage on.Curr Stem Cell Res Ther. 2009 Jan;4(1):50-60. doi: 10.2174/157488809787169110. Curr Stem Cell Res Ther. 2009. PMID: 19149630 Review.
Cited by
-
Clinical Relevancy of Circulating Tumor Cells in Breast Cancer: Epithelial or Mesenchymal Characteristics, Single Cells or Clusters?Int J Mol Sci. 2022 Oct 12;23(20):12141. doi: 10.3390/ijms232012141. Int J Mol Sci. 2022. PMID: 36292996 Free PMC article. Review.
-
Bidirectional crosstalk between PD-L1 expression and epithelial to mesenchymal transition: significance in claudin-low breast cancer cells.Mol Cancer. 2015 Aug 7;14:149. doi: 10.1186/s12943-015-0421-2. Mol Cancer. 2015. PMID: 26245467 Free PMC article.
-
Profiling of mature-stage human breast milk cells identifies six unique lactocyte subpopulations.Sci Adv. 2022 Jul;8(26):eabm6865. doi: 10.1126/sciadv.abm6865. Epub 2022 Jun 29. Sci Adv. 2022. PMID: 35767604 Free PMC article.
-
The Cellular Origin and Evolution of Breast Cancer.Cold Spring Harb Perspect Med. 2017 Mar 1;7(3):a027128. doi: 10.1101/cshperspect.a027128. Cold Spring Harb Perspect Med. 2017. PMID: 28062556 Free PMC article. Review.
-
PD-L1 promotes OCT4 and Nanog expression in breast cancer stem cells by sustaining PI3K/AKT pathway activation.Int J Cancer. 2017 Oct 1;141(7):1402-1412. doi: 10.1002/ijc.30834. Epub 2017 Jun 30. Int J Cancer. 2017. PMID: 28614911 Free PMC article.
References
Publication types
MeSH terms
Substances
LinkOut - more resources
Full Text Sources
Other Literature Sources
Medical
