

Identifying Darwinian selection acting on different human APOL1 variants among diverse African populations
- PMID: 23768513
- PMCID: PMC3710747
- DOI: 10.1016/j.ajhg.2013.05.014
Identifying Darwinian selection acting on different human APOL1 variants among diverse African populations
Erratum in
- Am J Hum Genet. 2013 Jul 11;93(1):191. An, Ping [added]; Winkler, Cheryl A [added]
Abstract
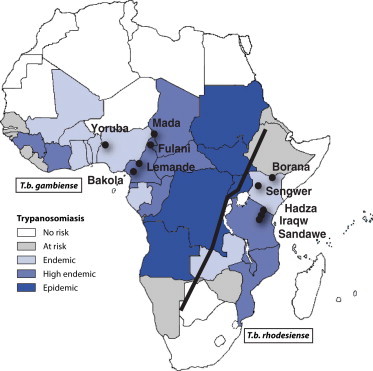
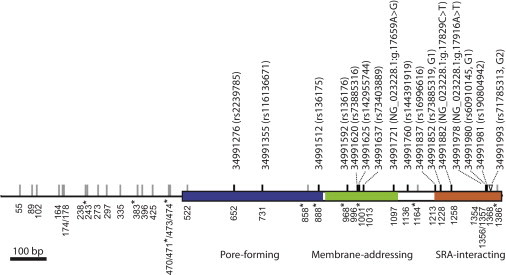
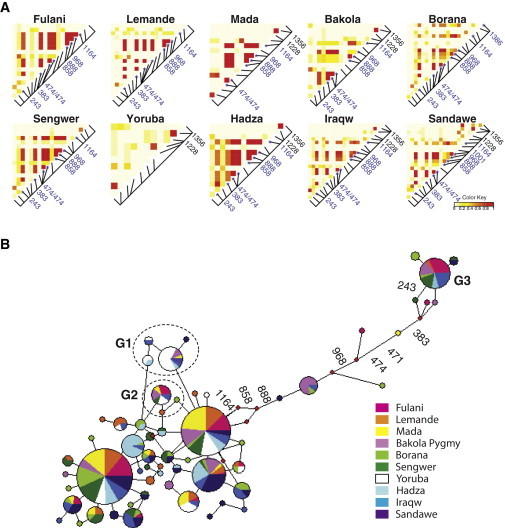
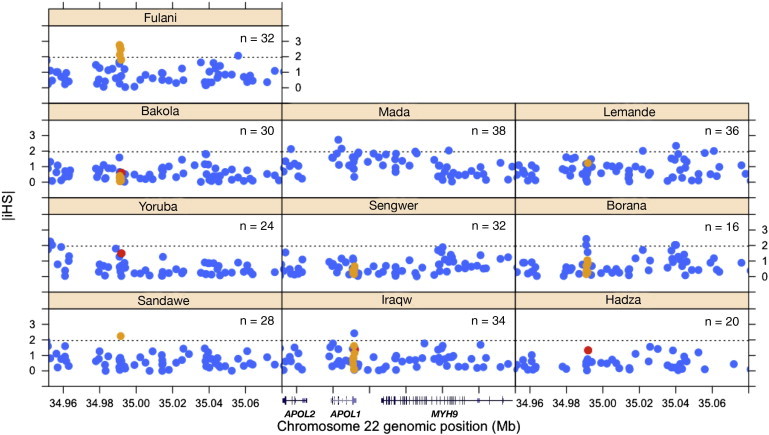
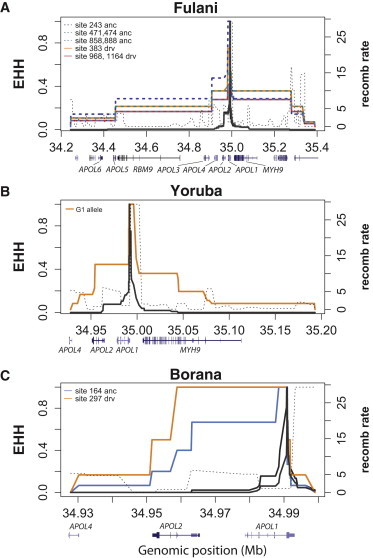
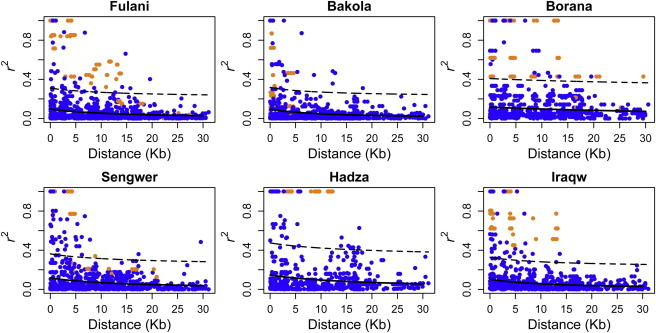
Disease susceptibility can arise as a consequence of adaptation to infectious disease. Recent findings have suggested that higher rates of chronic kidney disease (CKD) in individuals with recent African ancestry might be attributed to two risk alleles (G1 and G2) at the serum-resistance-associated (SRA)-interacting-domain-encoding region of APOL1. These two alleles appear to have arisen adaptively, possibly as a result of their protective effects against human African trypanosomiasis (HAT), or African sleeping sickness. In order to explore the distribution of potential functional variation at APOL1, we studied nucleotide variation in 187 individuals across ten geographically and genetically diverse African ethnic groups with exposure to two Trypanosoma brucei subspecies that cause HAT. We observed unusually high levels of nonsynonymous polymorphism in the regions encoding the functional domains that are required for lysing parasites. Whereas allele frequencies of G2 were similar across all populations (3%-8%), the G1 allele was only common in the Yoruba (39%). Additionally, we identified a haplotype (termed G3) that contains a nonsynonymous change at the membrane-addressing-domain-encoding region of APOL1 and is present in all populations except for the Yoruba. Analyses of long-range patterns of linkage disequilibrium indicate evidence of recent selection acting on the G3 haplotype in Fulani from Cameroon. Our results indicate that the G1 and G2 variants in APOL1 are geographically restricted and that there might be other functional variants that could play a role in HAT resistance and CKD risk in African populations.
Copyright © 2013 The American Society of Human Genetics. Published by Elsevier Inc. All rights reserved.
Figures
References
-
- Barreiro L.B., Quintana-Murci L. From evolutionary genetics to human immunology: how selection shapes host defence genes. Nat. Rev. Genet. 2010;11:17–30. - PubMed
-
- Haldane J.B.S. Longmans, Green & Co.; London: 1932. The Causes of Evolution.
-
- Pauling L., Itano H.A., Wells I. Sickle cell anemia a molecular disease. Science. 1949;110:543–548. - PubMed
-
- Haldane, J.B.S. (1949). The Rate of Mutations of Human Genes. Proceedings of the Eighth International Congress of Genetics, 267–273.
Publication types
MeSH terms
Substances
Associated data
- Actions
- Actions
- Actions
- Actions
- Actions
- Actions
- Actions
- Actions
- Actions
- Actions
- Actions
- Actions
- Actions
- Actions
- Actions
- Actions
- Actions
- Actions
- Actions
- Actions
- Actions
- Actions
- Actions
- Actions
- Actions
- Actions
- Actions
- Actions
- Actions
- Actions
- Actions
- Actions
- Actions
- Actions
- Actions
- Actions
- Actions
- Actions
- Actions
- Actions
- Actions
- Actions
- Actions
- Actions
- Actions
- Actions
- Actions
- Actions
- Actions
- Actions
- Actions
- Actions
- Actions
- Actions
- Actions
- Actions
- Actions
- Actions
- Actions
- Actions
- Actions
- Actions
- Actions
- Actions
- Actions
- Actions
- Actions
- Actions
- Actions
- Actions
- Actions
- Actions
- Actions
- Actions
- Actions
- Actions
- Actions
- Actions
- Actions
- Actions
- Actions
- Actions
- Actions
- Actions
- Actions
- Actions
- Actions
- Actions
- Actions
- Actions
- Actions
- Actions
- Actions
- Actions
- Actions
- Actions
- Actions
- Actions
- Actions
- Actions
- Actions
- Actions
- Actions
- Actions
- Actions
- Actions
- Actions
- Actions
- Actions
- Actions
- Actions
- Actions
- Actions
- Actions
- Actions
- Actions
- Actions
- Actions
- Actions
- Actions
- Actions
- Actions
- Actions
- Actions
- Actions
- Actions
- Actions
- Actions
- Actions
- Actions
- Actions
- Actions
- Actions
- Actions
- Actions
- Actions
- Actions
- Actions
- Actions
- Actions
- Actions
- Actions
- Actions
- Actions
- Actions
- Actions
- Actions
- Actions
- Actions
- Actions
- Actions
- Actions
- Actions
- Actions
- Actions
- Actions
- Actions
- Actions
- Actions
- Actions
- Actions
- Actions
- Actions
- Actions
- Actions
- Actions
- Actions
- Actions
- Actions
- Actions
- Actions
- Actions
- Actions
- Actions
- Actions
- Actions
- Actions
- Actions
- Actions
- Actions
- Actions
- Actions
- Actions
- Actions
- Actions
- Actions
- Actions
Grants and funding
LinkOut - more resources
Full Text Sources
Other Literature Sources
Miscellaneous
