. 2013 Jul 11;93(1):42-53.
doi: 10.1016/j.ajhg.2013.05.010. Epub 2013 Jun 13.

General framework for meta-analysis of rare variants in sequencing association studies

Affiliations

General framework for meta-analysis of rare variants in sequencing association studies

Seunggeun Lee et al. Am J Hum Genet. .

Abstract

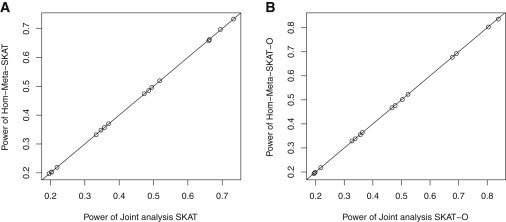
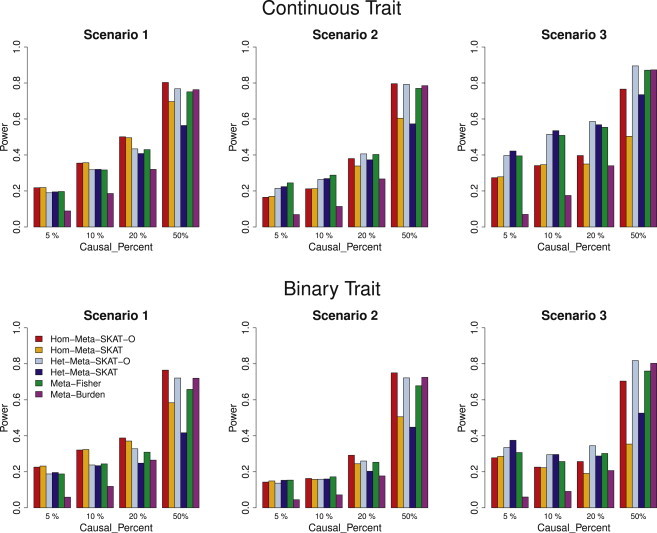
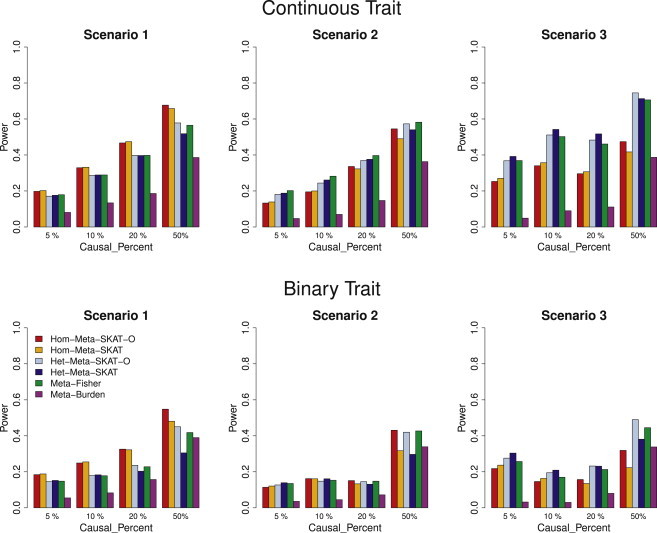
We propose a general statistical framework for meta-analysis of gene- or region-based multimarker rare variant association tests in sequencing association studies. In genome-wide association studies, single-marker meta-analysis has been widely used to increase statistical power by combining results via regression coefficients and standard errors from different studies. In analysis of rare variants in sequencing studies, region-based multimarker tests are often used to increase power. We propose meta-analysis methods for commonly used gene- or region-based rare variants tests, such as burden tests and variance component tests. Because estimation of regression coefficients of individual rare variants is often unstable or not feasible, the proposed method avoids this difficulty by calculating score statistics instead that only require fitting the null model for each study and then aggregating these score statistics across studies. Our proposed meta-analysis rare variant association tests are conducted based on study-specific summary statistics, specifically score statistics for each variant and between-variant covariance-type (linkage disequilibrium) relationship statistics for each gene or region. The proposed methods are able to incorporate different levels of heterogeneity of genetic effects across studies and are applicable to meta-analysis of multiple ancestry groups. We show that the proposed methods are essentially as powerful as joint analysis by directly pooling individual level genotype data. We conduct extensive simulations to evaluate the performance of our methods by varying levels of heterogeneity across studies, and we apply the proposed methods to meta-analysis of rare variant effects in a multicohort study of the genetics of blood lipid levels.


Figures

Figure 1
Figure 1
Comparisons of Meta and Joint Analysis of SKAT and SKAT-O Sixteen dots represent sixteen combinations of scenarios (scenarios 1 and 4), the percentage of causal variants (5%, 10%, 20%, and 50%), and the percentage of risk-decreasing variants (0% and 20%). Empirical powers were obtained at α = 2.5 × 10−6. (A) Comparison of Hom-Meta-SKAT and joint analysis SKAT. (B) Comparison of Hom-Meta-SKAT-O and joint analysis SKAT-O.
Figure 2
Figure 2
Power Comparisons of the Six Competing Methods when All Causal Variants Were Risk Increasing Empirical power at α = 2.5 × 10−6 with different study cohort sizes (Table 1) when all causal variants in a region were risk increasing. Hom-Meta-SKAT and Hom-Meta-SKAT-O used the same weights for different studies calculated with the pooled MAF estimates and Meta-Fisher and Meta-Burden used the study-specific weights. In scenarios 1 and 2, Het-Meta-SKAT and Het-Meta-SKAT-O were conducted by assuming study-specific heterogeneity with study-specific weights. In scenario 3, Het-Meta-SKAT and Het-Meta-SKAT-O were conducted by assuming ancestry-specific heterogeneity with ancestry-specific weights. For each scenario, we considered three settings by randomly selecting 5%, 10%, 20%, and 50% of variants with MAF < 3% in a randomly selected 3 kb region as causal variants. For causal variants, we assumed that β = c|log10(MAF)|. Different c values were used for three different percentages of causal variants (see Methods). Therefore the power across the three settings (5%, 10%, 20%, and 50% of variants being causal) in each figure are not comparable.
Figure 3
Figure 3
Power Comparisons of the Six Competing Methods when 20%/80% of Causal Variants Were Risk-Decreasing/Risk-Increasing Empirical power at α = 2.5 × 10−6 with different study cohort sizes (Table 1) assuming 20% of the causal variants were risk decreasing and 80% of the causal variants were risk increasing. Hom-Meta-SKAT and Hom-Meta-SKAT-O used the same weights for different studies calculated via the pooled MAF estimates, and Meta-Fisher and Meta-Burden used the study-specific weights. In scenarios 1 and 2, Het-Meta-SKAT and Het-Meta-SKAT-O were conducted by assuming study-specific heterogeneity with study-specific weights. In scenario 3, Het-Meta-SKAT and Het-Meta-SKAT-O were conducted by assuming ancestry-specific heterogeneity with ancestry-specific weights. For each scenario, we considered three settings by randomly selecting 5%, 10%, 20%, and 50% of variants with MAF < 3% in a randomly selected 3 kb region as causal variants. For causal variants, we assumed that β = c|log10(MAF)|. Different c values were used for three different percentages of causal variants (see Methods). Therefore the power across the three settings (5%, 10%, 20%, and 50% of variants being causal) in each figure are not comparable.

References

    1. Ansorge W.J. Next-generation DNA sequencing techniques. New Biotechnol. 2009;25:195–203. - PubMed
    1. Ladouceur M., Dastani Z., Aulchenko Y.S., Greenwood C.M.T., Richards J.B. The empirical power of rare variant association methods: results from sanger sequencing in 1,998 individuals. PLoS Genet. 2012;8:e1002496. - PMC - PubMed
    1. Li B., Leal S.M. Methods for detecting associations with rare variants for common diseases: application to analysis of sequence data. Am. J. Hum. Genet. 2008;83:311–321. - PMC - PubMed
    1. Madsen B.E., Browning S.R. A groupwise association test for rare mutations using a weighted sum statistic. PLoS Genet. 2009;5:e1000384. - PMC - PubMed
    1. Price A.L., Kryukov G.V., de Bakker P.I.W., Purcell S.M., Staples J., Wei L.J., Sunyaev S.R. Pooled association tests for rare variants in exon-resequencing studies. Am. J. Hum. Genet. 2010;86:832–838. - PMC - PubMed

Publication types