

Childhood asthma hospitalizations in the United States, 2000-2009
- PMID: 23769497
- PMCID: PMC3786053
- DOI: 10.1016/j.jpeds.2013.05.002
Childhood asthma hospitalizations in the United States, 2000-2009
Abstract
Objective: To examine temporal trends in the US incidence of childhood asthma hospitalizations, in-hospital mortality, mechanical ventilation use, and hospital charges between 2000 and 2009.
Study design: This was a serial, cross-sectional analysis of a nationally representative sample of children hospitalized with acute asthma. The Kids Inpatient Database was used to identify children aged <18 years with asthma by International Classification of Diseases, Ninth Revision, Clinical Modification code 493.xx. Outcome measures were asthma hospitalization incidence, in-hospital mortality, mechanical ventilation use, and hospital charges. We examined temporal trends of each outcome, accounting for sampling weights. Hospital charges were adjusted for inflation to 2009 US dollars.
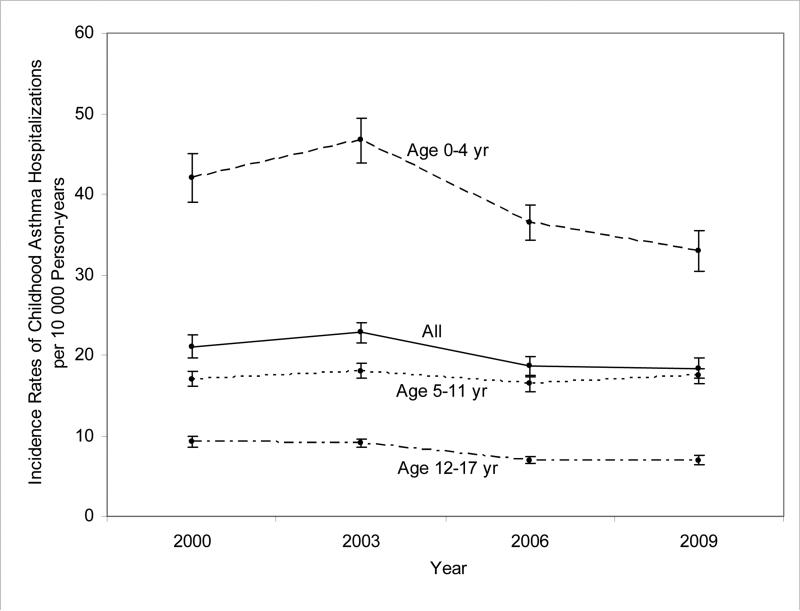
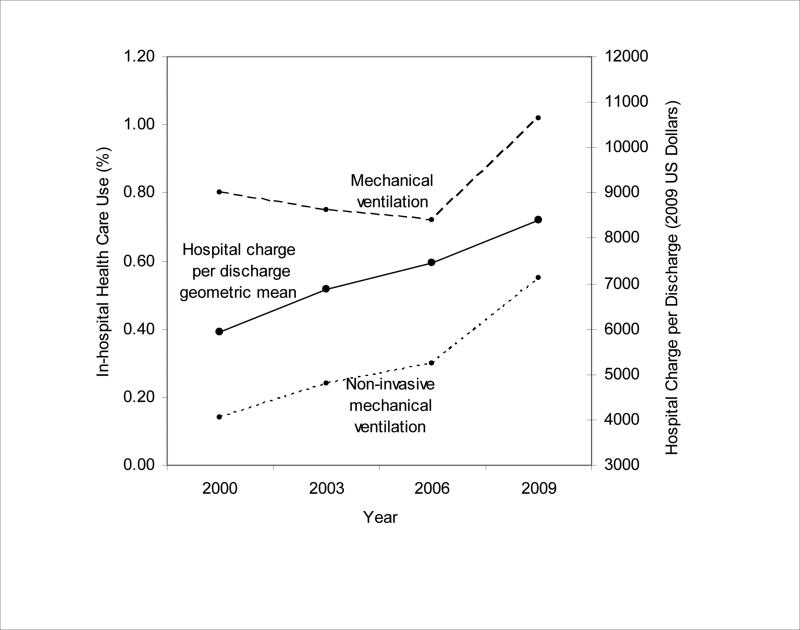
Results: The 4 separate years (2000, 2003, 2006, and 2009) of national discharge data included a total of 592805 weighted discharges with asthma. Between 2000 and 2009, the rate of asthma hospitalization in US children decreased from 21.1 to 18.4 per 10000 person-years (13% decrease; Ptrend < .001). Mortality declined significantly after adjusting for confounders (OR for comparison of 2009 with 2000, 0.37; 95% CI, 0.17-0.79). In contrast, there was an increase in the use of mechanical ventilation (from 0.8% to 1.0%, a 28% increase; Ptrend < .001). Nationwide hospital charges also increased from $1.27 billion to $1.59 billion (26% increase; Ptrend < .001); this increase was driven by a rise in the geometric mean of hospital charges per discharge, from $5940 to $8410 (42% increase; Ptrend < .001).
Conclusion: Between 2000 and 2009, we found significant declines in asthma hospitalization and in-hospital mortality among US children. In contrast, mechanical ventilation use and hospital charges for asthma increased significantly over this same period.
Keywords: AHRQ; Agency for Healthcare Research and Quality; CCS; Clinical Classifications Software; HCUP; Healthcare Cost and Utilization Project; ICD-9-CM; International Classification of Diseases, Ninth Revision, Clinical Modification; KID; Kids' Inpatient Database.
Copyright © 2013 Mosby, Inc. All rights reserved.
Figures
References
-
- Akinbami LJ, Moorman JE, Garbe PL, Sondik EJ. Status of childhood asthma in the United States, 1980-2007. Pediatrics. 2009;123(Suppl 3):S131–45. - PubMed
-
- Akinbami LJ, Schoendorf KC. Trends in childhood asthma: prevalence, health care utilization, and mortality. Pediatrics. 2002;110:315–22. - PubMed
-
- Newacheck PW, Halfon N. Prevalence, impact, and trends in childhood disability due to asthma. Arch Pediatr Adolesc Med. 2000;154:287–93. - PubMed
-
- American Lung Association [2013 January 15];Trends in asthma morbidity and mortality. 2012 Available from http://www.lung.org/finding-cures/our-research/epidemiology-and-statisti....
-
- Hartman ME, Linde-Zwirble WT, Angus DC, Watson RS. Trends in admissions for pediatric status asthmaticus in New Jersey over a 15-year period. Pediatrics. 2010;126:e904–11. - PubMed
Publication types
MeSH terms
Grants and funding
LinkOut - more resources
Full Text Sources
Other Literature Sources
Medical
