

Children with autism spectrum disorders show abnormal conditioned response timing on delay, but not trace, eyeblink conditioning
- PMID: 23769889
- PMCID: PMC3791861
- DOI: 10.1016/j.neuroscience.2013.06.007
Children with autism spectrum disorders show abnormal conditioned response timing on delay, but not trace, eyeblink conditioning
Abstract
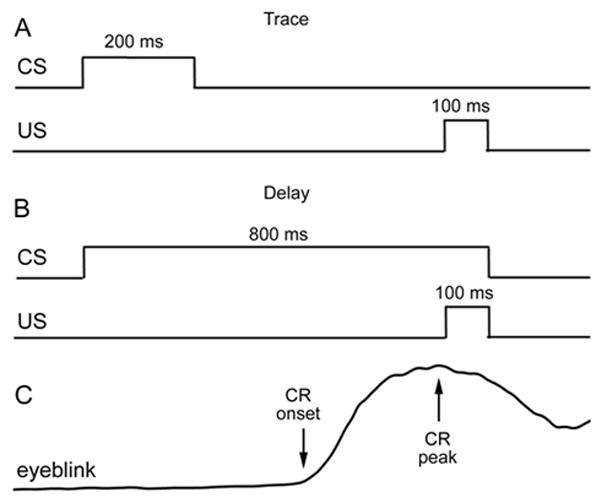
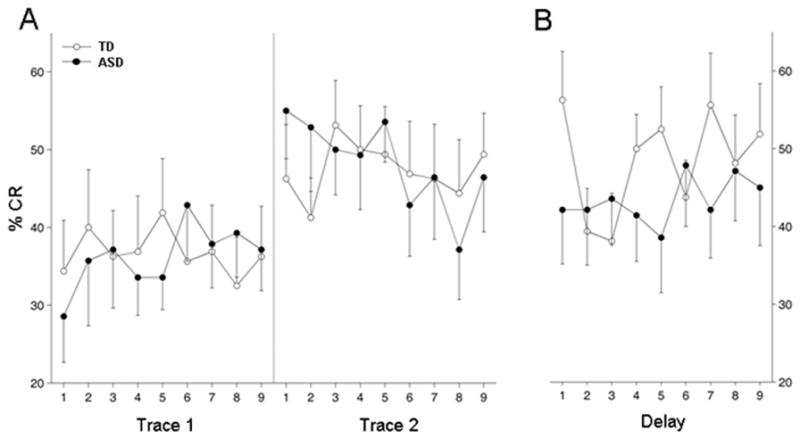
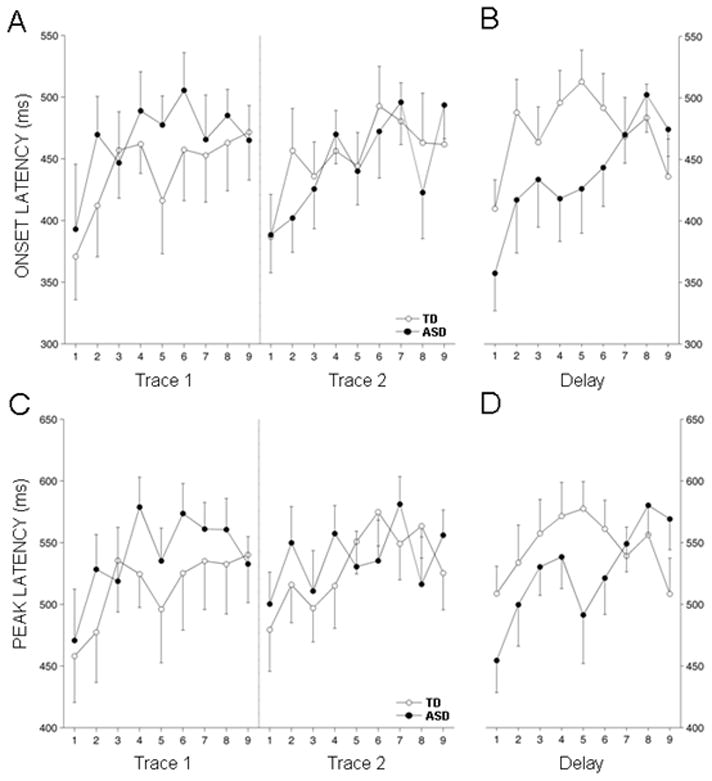
Children with autism spectrum disorder (ASD) and age-matched typically-developing (TD) peers were tested on two forms of eyeblink conditioning (EBC), a Pavlovian associative learning paradigm where subjects learn to execute an appropriately-timed eyeblink in response to a previously neutral conditioning stimulus (CS). One version of the task, trace EBC, interposes a stimulus-free interval between the presentation of the CS and the unconditioned stimulus (US), a puff of air to the eye which causes the subjects to blink. In delay EBC, the CS overlaps in time with the delivery of the US, usually with both stimuli terminating simultaneously. ASD children performed normally during trace EBC, exhibiting no differences from TD subjects with regard to the learning rate or the timing of the conditioned response. However, when subsequently tested on delay EBC, subjects with ASD displayed abnormally-timed conditioned eye blinks that began earlier and peaked sooner than those of TD subjects, consistent with previous findings. The results suggest an impaired ability of children with ASD to properly time conditioned eye blinks which appears to be specific to delay EBC. We suggest that this deficit may reflect a dysfunction of the cerebellar cortex in which increases in the intensity or duration of sensory input can temporarily disrupt the accuracy of motor timing over short temporal intervals.
Keywords: ADI-R; ANOVA; ASD; Autism Diagnostic Interview; CR; CS; PDD-NOS; TD; UR; US; analysis of variance; autism; autism spectrum disorder; cerebellum; conditioned response; conditioning stimulus; eyeblink conditioning; pervasive developmental disorder-not otherwise specified; timing; typically-developing; unconditioned response; unconditioned stimulus.
Copyright © 2013 IBRO. Published by Elsevier Ltd. All rights reserved.
Figures
References
-
- Amaral DG, Schumann CM, Nordahl CW. Neuroanatomy of autism. Trends in Neuroscience. 2008;31:137–142. - PubMed
-
- American Psychiatric Association. Diagnostic and Statistical Manual of Mental Disorders. 4. 2000.
-
- Bauman ML, Kemper TL. Neuroanatomic observations of the brain in autism. In: Bauman ML, Kemper TL, editors. The Neurobiology of Autism. Baltimore, MD: Johns Hopkins University Press; 1994. pp. 119–145.
-
- Bode MK, Mattila ML, Kiviniemi V, Rahko J, Moilanen I, Ebeling H, et al. White matter in autism spectrum disorders – evidence of impaired fiber formation. Acta Radiology. 2011;52:1169–1174. - PubMed
Publication types
MeSH terms
Grants and funding
LinkOut - more resources
Full Text Sources
Other Literature Sources
