

In vivo high-resolution diffusion tensor imaging of the mouse brain
- PMID: 23769916
- PMCID: PMC3797856
- DOI: 10.1016/j.neuroimage.2013.06.012
In vivo high-resolution diffusion tensor imaging of the mouse brain
Abstract
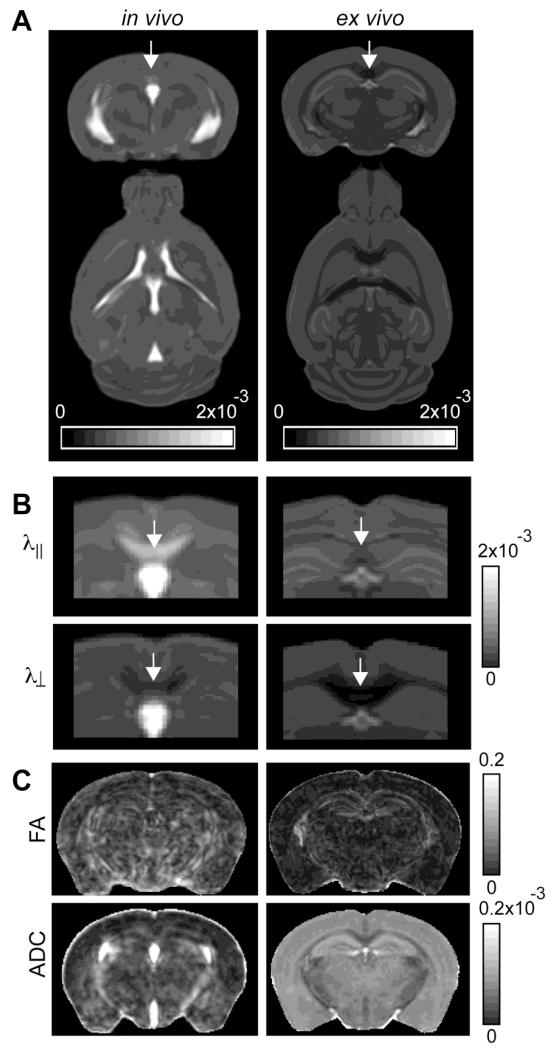
Diffusion tensor imaging (DTI) of the laboratory mouse brain provides important macroscopic information for anatomical characterization of mouse models in basic research. Currently, in vivo DTI of the mouse brain is often limited by the available resolution. In this study, we demonstrate in vivo high-resolution DTI of the mouse brain using a cryogenic probe and a modified diffusion-weighted gradient and spin echo (GRASE) imaging sequence at 11.7 T. Three-dimensional (3D) DTI of the entire mouse brain at 0.125 mm isotropic resolution could be obtained in approximately 2 h. The high spatial resolution, which was previously only available with ex vivo imaging, enabled non-invasive examination of small structures in the adult and neonatal mouse brains. Based on data acquired from eight adult mice, a group-averaged DTI atlas of the in vivo adult mouse brain with 60 structure segmentations was developed. Comparisons between in vivo and ex vivo mouse brain DTI data showed significant differences in brain morphology and tissue contrasts, which indicate the importance of the in vivo DTI-based mouse brain atlas.
Keywords: Brain atlas; Diffusion tensor imaging; High-resolution; In vivo; Magnetic resonance imaging; Mouse brain.
Copyright © 2013 Elsevier Inc. All rights reserved.
Figures


Similar articles
-
A practical approach to in vivo high-resolution diffusion tensor imaging of rhesus monkeys on a 3-T human scanner.Magn Reson Imaging. 2009 Apr;27(3):335-46. doi: 10.1016/j.mri.2008.07.004. Epub 2008 Sep 2. Magn Reson Imaging. 2009. PMID: 18768280
-
Diffusion tensor-based fast marching for modeling human brain connectivity network.Comput Med Imaging Graph. 2011 Apr;35(3):167-78. doi: 10.1016/j.compmedimag.2010.07.008. Epub 2010 Oct 28. Comput Med Imaging Graph. 2011. PMID: 21035304 Free PMC article.
-
In vivo quantitative whole-brain diffusion tensor imaging analysis of APP/PS1 transgenic mice using voxel-based and atlas-based methods.Neuroradiology. 2013 Aug;55(8):1027-1038. doi: 10.1007/s00234-013-1195-0. Epub 2013 May 5. Neuroradiology. 2013. PMID: 23644540
-
Delineating neural structures of developmental human brains with diffusion tensor imaging.ScientificWorldJournal. 2010 Jan 21;10:135-44. doi: 10.1100/tsw.2010.21. ScientificWorldJournal. 2010. PMID: 20098957 Free PMC article. Review.
-
Diffusion tensor imaging in abdominal organs.NMR Biomed. 2017 Mar;30(3). doi: 10.1002/nbm.3434. Epub 2015 Nov 11. NMR Biomed. 2017. PMID: 26556181 Review.
Cited by
-
Microstructural Tissue Changes in a Rat Model of Mild Traumatic Brain Injury.Front Neurosci. 2021 Nov 26;15:746214. doi: 10.3389/fnins.2021.746214. eCollection 2021. Front Neurosci. 2021. PMID: 34899158 Free PMC article.
-
Mouse brain MR super-resolution using a deep learning network trained with optical imaging data.Front Radiol. 2023 May 15;3:1155866. doi: 10.3389/fradi.2023.1155866. eCollection 2023. Front Radiol. 2023. PMID: 37492378 Free PMC article.
-
Early life stress causes sex-specific changes in adult fronto-limbic connectivity that differentially drive learning.Elife. 2020 Dec 1;9:e58301. doi: 10.7554/eLife.58301. Elife. 2020. PMID: 33259286 Free PMC article.
-
Relationship between regional volume changes and water diffusion in fixed marmoset brains: an in vivo and ex vivo comparison.Sci Rep. 2024 Nov 6;14(1):26901. doi: 10.1038/s41598-024-78246-0. Sci Rep. 2024. PMID: 39505977 Free PMC article.
-
Comparative profiling of white matter development in the human and mouse brain reveals volumetric deficits and delayed myelination in Angelman syndrome.Mol Autism. 2024 Dec 26;15(1):54. doi: 10.1186/s13229-024-00636-y. Mol Autism. 2024. PMID: 39726042 Free PMC article.
References
-
- Ali AA, Dale AM, Badea A, Johnson GA. Automated segmentation of neuroanatomical structures in multispectral MR microscopy of the mouse brain. NeuroImage. 2005;27:425–435. - PubMed
Publication types
MeSH terms
Grants and funding
- R01 HD074593/HD/NICHD NIH HHS/United States
- R01HD070996/HD/NICHD NIH HHS/United States
- R01 EB003543/EB/NIBIB NIH HHS/United States
- R01NS070909/NS/NINDS NIH HHS/United States
- R21 NS059529/NS/NINDS NIH HHS/United States
- R01EB015031/EB/NIBIB NIH HHS/United States
- R01 EB012590/EB/NIBIB NIH HHS/United States
- R01AG20012/AG/NIA NIH HHS/United States
- R01 HD070996/HD/NICHD NIH HHS/United States
- R01 NS070909/NS/NINDS NIH HHS/United States
- R01EB003543/EB/NIBIB NIH HHS/United States
- S10 RR028955/RR/NCRR NIH HHS/United States
- R01 AG020012/AG/NIA NIH HHS/United States
- 1S10RR028955/RR/NCRR NIH HHS/United States
- R01 EB015031/EB/NIBIB NIH HHS/United States
- P41EB015909/EB/NIBIB NIH HHS/United States
- P41 EB015909/EB/NIBIB NIH HHS/United States
LinkOut - more resources
Full Text Sources
Other Literature Sources
