. 2013 Jun 24;25(6):572-84.
doi: 10.1016/j.devcel.2013.05.007. Epub 2013 Jun 13.

Protein aggregation behavior regulates cyclin transcript localization and cell-cycle control

Affiliations

Protein aggregation behavior regulates cyclin transcript localization and cell-cycle control

Changhwan Lee et al. Dev Cell. .

Abstract

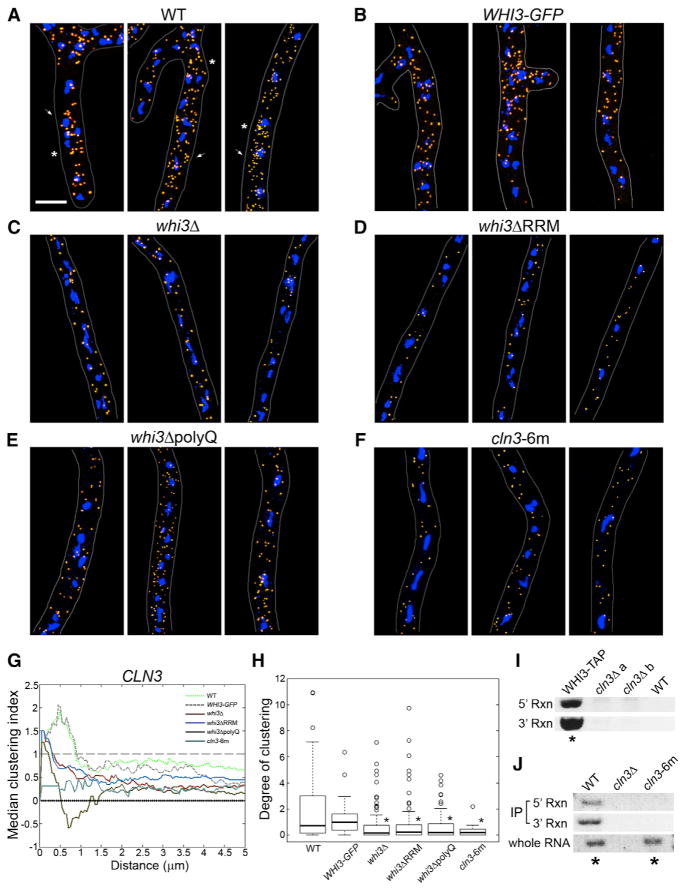
Little is known about the active positioning of transcripts outside of embryogenesis or highly polarized cells. We show here that a specific G1 cyclin transcript is highly clustered in the cytoplasm of large multinucleate cells. This heterogeneous cyclin transcript localization results from aggregation of an RNA-binding protein, and deletion of a polyglutamine stretch in this protein results in random transcript localization. These multinucleate cells are remarkable in that nuclei cycle asynchronously despite sharing a common cytoplasm. Notably, randomization of cyclin transcript localization significantly diminishes nucleus-to-nucleus differences in the number of mRNAs and synchronizes cell-cycle timing. Thus, nonrandom cyclin transcript localization is important for cell-cycle timing control and arises due to polyQ-dependent behavior of an RNA-binding protein. There is a widespread association between polyQ expansions and RNA-binding motifs, suggesting that this is a broadly exploited mechanism to produce spatially variable transcripts and heterogeneous cell behaviors. PAPERCLIP:


Figures

Figure 1
Figure 1. Cyclin Transcripts Are Variably Distributed in Cytoplasm in Ashbya
(A–G) Each cyclin transcript (orange) is visualized in wild-type A. gossypii or null mutant strain by single-molecule RNA FISH. Nuclei (blue) are visualized by Hoechst staining. Images are projected through the z axis. Cell boundary is in gray. Scale bar represents 5 μm. (H) One example of RNA FISH image processing. Top: a 3D hyphal image is acquired and imported into ImageJ to automatically detect mRNAs (orange), nuclei (blue), and cytoplasmic area (green lines) in 3D. Middle: the information of detected spots such as x, y, z coordinates, volumes, and signal intensities are imported into MATLAB for further analyses. Bottom: spatially random mRNAs are simulated using Poisson distribution using the same mRNA density as the input data. One of 100 simulated random mRNA sets (black) is shown. Scale bar represents 5 μm. See also Figure S1.
Figure 2
Figure 2. The G1 Cyclin CLN3 Transcript Is Highly Clustered in the Cytoplasm
(A) Fluorescence intensity of CLN3 transcript spots are normalized by mean signal intensity in each individual hyphal image for WT, WHI3-GFP, whi3Δ, whi3ΔRRM, whi3ΔpolyQ, and cln3-6 m (n = 3,130, 1,611, 2,435, 2,577, 3,826, and 1,071, respectively). The relative fluorescence intensities for all strains were compared to WT by the Kolmogorov-Smirnov (K-S) test with *p < 0.001. (B) The nearest neighbor distances are measured for all CLN3 transcript spots in each image and referred to as the intertranscript distances (ITDs). ITDs >10 μm are shown as 10 μm. ITDs in all strains were compared to WT by the K-S test with *p < 0.001. See also Figure S2. (C) Spatial point pattern analysis using Ripley’s K function. Left: a hypothetical case in which mRNAs are clustered (top) and another in which localization of mRNAs is spatially random (bottom). Top right: clustered mRNAs (orange) have distinctively higher cumulative number of mRNA at a particular distance (black). Middle right: black dotted lines are 95% confidence interval (CI) of a Poisson random mRNA distribution from 100 simulations. Empirical curve of cumulative number of mRNA (orange) above 95% CI random range (black dashes) is indicative of clustering with p < 0.05. Bottom right: the cumulative number of mRNA is normalized by the upper random bound. See also Figure S3. (D) Median clustering index is the median value of Ripley’s H(d)* at distance d across all mRNA spots for each cyclin transcript (n > 55 cells for all transcripts). Green, CLN3; blue, CLN1/2; yellow, CLB5/6; magenta, CLB1/2; red, GPM2/3. See Figures S1 and S3 and Spatial Point Pattern Analysis for Single-Molecule RNA FISH Data. (E) Area of plots of Ripley’s H(d)* > 1 for each hyphal image is calculated for each cyclin transcript. This area is defined as “degree of clustering” where higher value indicates more clustering. Only degree of clustering for CLN3 mRNA is significantly different from other transcripts. *p < 0.001 by Wilcoxon test. Kruskal-Wallis test is used for nonparametric ANOVA and Wilcoxon test is used for nonparametric multiple comparison test. For the box-and-whiskers plot, bold line in the box: median, top, and bottom of the box: the third and first quartiles, respectively, whiskers: maximum and minimum of the data point excluding the outliers (open circle, data farther than 1.5× the first or third quartile from the median).
Figure 3
Figure 3. CLN3 Transcript Clustering Requires the RNA-Binding Protein Whi3
(A–F) CLN3 mRNA is visualized by single-molecule RNA FISH in WT, whi3, or cln3-6 m mutants. Cell boundary is in gray, mRNA is orange, nuclei are blue. (A) Arrow highlights large cluster, asterisk highlights subdifraction cluster. Scale bar represents 5 μm. See also Figure S4. (G) Median clustering index (the median of Ripley’s H(d)*) for CLN3 mRNA in WT or whi3 mutants; n > 72 for all strains. Light green, WT; dashed brown, WHI3-GFP; red, whi3Δ; blue, whi3ΔRRM; brown, whi3ΔpolyQ; blue, cln3-6m. (H) Degree of clustering (the area of Ripley’s H(d)* > 1). Degree of clustering for CLN3 mRNA in cln3-6 m or whi3 mutants are compared to WT. *p < 0.001 by Wilcoxon test. For the box-and-whiskers plot, bold line in the box: median, top, and bottom of the box: the third and first quartiles, respectively, whiskers: maximum and minimum of the data point excluding the outliers (open circle, data farther than 1.5×first or third quartile from the median). (I) Whi3-mRNA complexes are pulled down using RNA immunoprecipitation (RIP) with magnetic beads (Dynabead, Invitrogen) conjugated with anti-Tap antibodies. cDNA are generated from purified mRNA and detected on the Southern blot and identified by sequencing (indicated *). Both 5′ and 3′ regions of CLN3 ORF were amplified by PCR (5′ Rxn and 3′ Rxn). (J) A direct interaction of Whi3 and CLN3 mRNA is tested by in vitro binding assay (see In Vitro Protein-RNA Binding Assay). CLN3 mRNA bound to Whi3 are detected on the Southern blot and identified (*). 5′ ORF of CLN3 mRNA is amplified from whole mRNA to test if CLN3 transcripts are expressed and sequenced (*). See also Figure S3.
Figure 4
Figure 4. A PolyQ Expansion Is Required for Whi3 Heterogeneity and Can Limit Diffusivity
(A) Top: Whi3-2XGFP localization in live wild-type hyphae. Scale bar represents 5 μm. Bottom: fluorescence intensity from the top image is quantified below in the plot. Red line depicts the mean signal intensity along the hypha and range between two blue lines indicates the standard deviation of the signal intensity through the width of the hypha on each x position (see Signal Profile Plot for Assessment of Fluorescence Intensity Heterogeneity). (B) Whi3 and ER (Sec63-mCherry) localization in the same cell. White boxes in overlay are magnified (6×) in bottom images. Scale bars represent 5 μm. (C) Localization of Whi3ΔpolyQ-2XGFP in which PolyQ is replaced with 6HA epitope tags. (D) PolyQ-GFP where the polyQ region of the Ashbya Whi3 is expressed in frame with GFP in addition to WT Whi3. (E) Cytoplasmic soluble GFP is expressed in WT. (F) Heterogeneity of mean fluorescence intensity along the hypha is quantified. The data are log10-transformed for ANOVA and multiple comparisons. n > 119 for all strains. *p < 0.001 by pairwise t test. (G) Ashbya lysate pellet for the indicated strains grown at 30°C are separated on SDS-PAGE (10% acrylamide) and probed with anti-GFP or anti-Tubulin antibodies to quantify expression levels of Whi3. For α-GFP, an upper band is >260 kDa (dimer or higher) and a lower band is ~130 kDa (monomer). (H and I) FCS measurements in live cells (G) or with bacterially expressed proteins (H). Top: autocorrelation curves for FCS. Bars represent standard errors (n > 10). FCS is performed with purified proteins for (H) due to the noise in live cells. Bottom: diffusion coefficients are calculated based on the fitting to a single component anomalous diffusion model. *p < 0.01 by Kruskal-Wallis test. For the box-and-whiskers plot, bold line in the box: median, top and bottom of the box: the third circle, data farther than 1.5× the first or third quartile from the median). See also Figure S4.
Figure 5
Figure 5. CLN3 mRNA Clusters Are near Nuclei
(A) Histogram of distances of CLN3 mRNA clusters from nuclei in WT. The histogram is binned by 0.5 μm and radius of a nucleus is ~0.5 μm. (B) Percentage of nuclei that contain transcriptional hotspot (>1 mRNA in one mRNA spot within the nucleus) is obtained for all cyclin transcripts, n > 293. (C) Degrees of clustering for transcriptionally active or inactive nuclei. An active nucleus contains a transcript spot with >1 CLN3 mRNA. The difference between means are insignificant (p = 0.59 by Wilcoxon test). For the box-and-whiskers plot, bold line in the box: median, top, and bottom of the box: the third and first quartiles, respectively, whiskers: maximum and minimum of the data point excluding the outliers (open circle, data farther than 1.5× the first or third quartile from the median). (D) Histogram of the number of mRNA within 2 μm radius centered on each nucleus in WT or whi3 mutants, binned by 0.2 μm. Medians (M) and coefficient of variations (CV) are on the plots. See also Figure S5. (E) Histogram of the difference between neighboring nuclei in the number of mRNA within a 2 μm radius (black bars) is compared the corresponding differences resulting from the simulation assuming CSR mRNA spots (red curve). p < 0.001 by K-S test. n > 630. (F) Localization of Cln3-GFP in Ashbya. Nuclei are in blue. Red circle: nucleus based on DIC image. Cells are fixed and GFP-Booster (ChromoTek) was used to enhance the signal. Scale bar represents 5 μm.
Figure 6
Figure 6. Nuclear Division Is More Synchronous in whi3Δ Than Wild-Type Ashbya
(A) Time-lapse of nuclear division in WT. Non-mitotic nuclei are in green, mitotic nuclei are in magenta and cell boundary is in red. Asterisk (*) indicates onset of mitosis. Scale bars represent 5 μm. See also Movie S1. (B) Nuclear division in whi3Δ. (C) The synchrony index for whi3 mutants are compared to WT. *p < 0.004 by Wilcoxon test. (D) Internuclear distances in whi3 mutants are compared to WT (n > 711). *p < 0.001 by Wilcoxon test. For the box-and-whiskers plot, bold line in the box: median, top, and bottom of the box: the third and first quartiles, respectively, whiskers: maximum and minimum of the data point excluding the outliers (open circle, data farther than 1.5× the first or third quartile from the median).

Comment in

References

    1. Berleth T, Burri M, Thoma G, Bopp D, Richstein S, Frigerio G, Noll M, Nüsslein-Volhard C. The role of localization of bicoid RNA in organizing the anterior pattern of the Drosophila embryo. EMBO J. 1988;7:1749–1756. - PMC - PubMed
    1. Cardoso MC, Leonhardt H, Nadal-Ginard B. Reversal of terminal differentiation and control of DNA replication: cyclin A and Cdk2 specifically localize at subnuclear sites of DNA replication. Cell. 1993;74:979–992. - PubMed
    1. Decker CJ, Parker R. P-bodies and stress granules: possible roles in the control of translation and mRNA degradation. Cold Spring Harb Perspect Biol. 2012;4:a012286. - PMC - PubMed
    1. Decker CJ, Teixeira D, Parker R. Edc3p and a glutamine/asparagine-rich domain of Lsm4p function in processing body assembly in Saccharomyces cerevisiae. J Cell Biol. 2007;179:437–449. - PMC - PubMed
    1. Dietrich FS, Voegeli S, Brachat S, Lerch A, Gates K, Steiner S, Mohr C, Pöhlmann R, Luedi P, Choi S, et al. The Ashbya gossypii genome as a tool for mapping the ancient Saccharomyces cerevisiae genome. Science. 2004;304:304–307. - PubMed

Publication types

MeSH terms