

Improving ultrasound gene transfection efficiency by controlling ultrasound excitation of microbubbles
- PMID: 23770009
- PMCID: PMC3758692
- DOI: 10.1016/j.jconrel.2013.05.039
Improving ultrasound gene transfection efficiency by controlling ultrasound excitation of microbubbles
Abstract
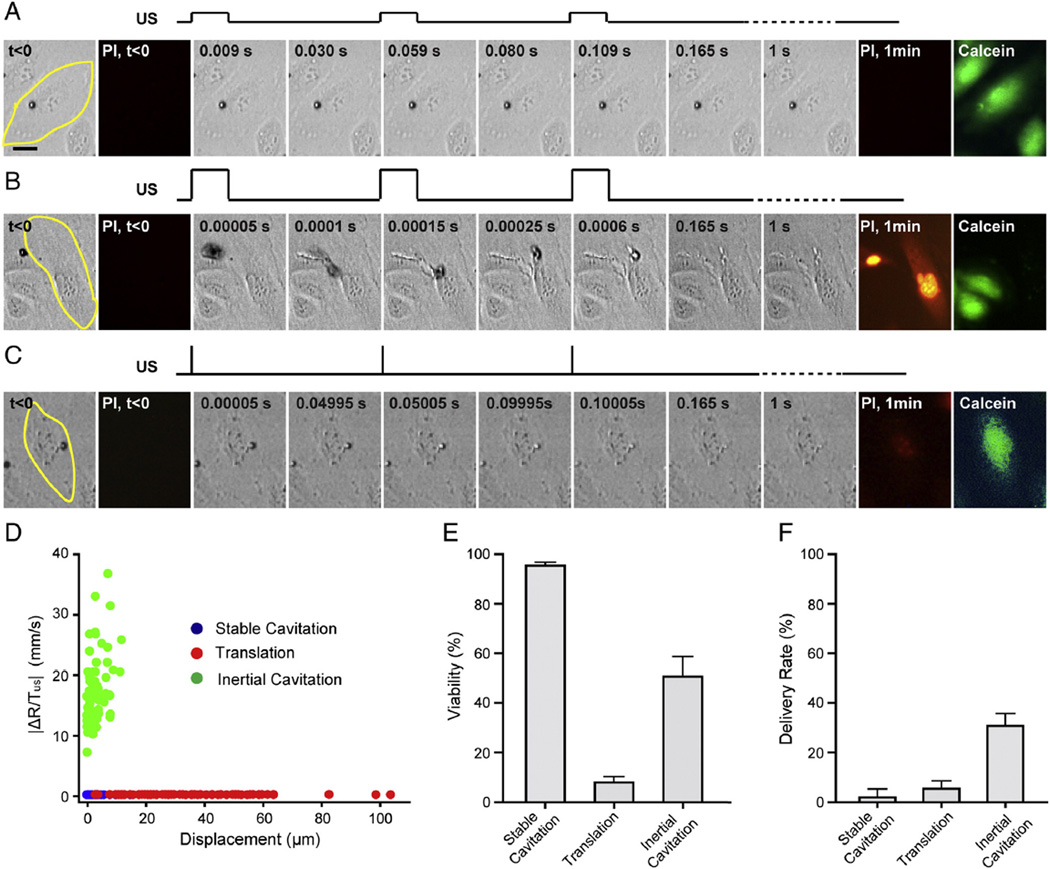
Ultrasound application in the presence of microbubbles has shown great potential for non-viral gene transfection via transient disruption of cell membrane (sonoporation). However, improvement of its efficiency has largely relied on empirical approaches without consistent and translatable results. The goal of this study is to develop a rational strategy based on new results obtained using novel experimental techniques and analysis to improve sonoporation gene transfection. In this study, we conducted experiments using targeted microbubbles that were attached to cell membrane to facilitate sonoporation. We quantified the dynamic activities of microbubbles exposed to pulsed ultrasound and the resulting sonoporation outcome, and identified distinct regimes of characteristic microbubble behaviors: stable cavitation, coalescence and translation, and inertial cavitation. We found that inertial cavitation generated the highest rate of membrane poration. By establishing direct correlation of ultrasound-induced bubble activities with intracellular uptake and pore size, we designed a ramped pulse exposure scheme for optimizing microbubble excitation to improve sonoporation gene transfection. We implemented a novel sonoporation gene transfection system using an aqueous two phase system (ATPS) for efficient use of reagents and high throughput operation. Using plasmids coding for the green fluorescence protein (GFP), we achieved a sonoporation transfection efficiency in rate aortic smooth muscle cells (RASMCs) of 6.9%±2.2% (n=9), comparable with lipofection (7.5%±0.8%, n=9). Our results reveal characteristic microbubble behaviors responsible for sonoporation and demonstrated a rational strategy to improve sonoporation gene transfection.
Keywords: Gene transfection; High speed videomicroscopy; Intracellular delivery; Microbubbles; Sonoporation; Ultrasound.
Copyright © 2013 Elsevier B.V. All rights reserved.
Figures


Similar articles
-
Characterization of the dynamic activities of a population of microbubbles driven by pulsed ultrasound exposure in sonoporation.Ultrasound Med Biol. 2014 Jun;40(6):1260-72. doi: 10.1016/j.ultrasmedbio.2013.12.002. Epub 2014 Jan 30. Ultrasound Med Biol. 2014. PMID: 24486236 Free PMC article.
-
The correlation between acoustic cavitation and sonoporation involved in ultrasound-mediated DNA transfection with polyethylenimine (PEI) in vitro.J Control Release. 2010 Jul 1;145(1):40-8. doi: 10.1016/j.jconrel.2010.04.010. Epub 2010 Apr 14. J Control Release. 2010. PMID: 20398711
-
Control of Acoustic Cavitation for Efficient Sonoporation with Phase-Shift Nanoemulsions.Ultrasound Med Biol. 2019 Mar;45(3):846-858. doi: 10.1016/j.ultrasmedbio.2018.12.001. Epub 2019 Jan 11. Ultrasound Med Biol. 2019. PMID: 30638968 Free PMC article.
-
Bursting bubbles and bilayers.Theranostics. 2012;2(12):1140-59. doi: 10.7150/thno.4305. Epub 2012 Dec 11. Theranostics. 2012. PMID: 23382772 Free PMC article. Review.
-
Understanding ultrasound induced sonoporation: definitions and underlying mechanisms.Adv Drug Deliv Rev. 2014 Jun;72:49-64. doi: 10.1016/j.addr.2013.11.008. Epub 2013 Nov 21. Adv Drug Deliv Rev. 2014. PMID: 24270006 Review.
Cited by
-
Applications of Ultrasound-Mediated Drug Delivery and Gene Therapy.Int J Mol Sci. 2021 Oct 25;22(21):11491. doi: 10.3390/ijms222111491. Int J Mol Sci. 2021. PMID: 34768922 Free PMC article. Review.
-
Two-bubble acoustic tweezing cytometry for biomechanical probing and stimulation of cells.Biophys J. 2015 Jan 6;108(1):32-42. doi: 10.1016/j.bpj.2014.11.050. Biophys J. 2015. PMID: 25564850 Free PMC article.
-
Dynamic Behavior of Polymer Microbubbles During Long Ultrasound Tone-Burst Excitation and Its Application for Sonoreperfusion Therapy.Ultrasound Med Biol. 2023 Apr;49(4):996-1006. doi: 10.1016/j.ultrasmedbio.2022.12.013. Epub 2023 Jan 24. Ultrasound Med Biol. 2023. PMID: 36697268 Free PMC article.
-
Fluid Viscosity Affects the Fragmentation and Inertial Cavitation Threshold of Lipid-Encapsulated Microbubbles.Ultrasound Med Biol. 2016 Mar;42(3):782-94. doi: 10.1016/j.ultrasmedbio.2015.10.023. Epub 2015 Dec 7. Ultrasound Med Biol. 2016. PMID: 26674676 Free PMC article.
-
Harnessing Ultrasound for Targeting Drug Delivery to the Brain and Breaching the Blood-Brain Tumour Barrier.Pharmaceutics. 2022 Oct 19;14(10):2231. doi: 10.3390/pharmaceutics14102231. Pharmaceutics. 2022. PMID: 36297666 Free PMC article. Review.
References
-
- Li YS, Davidson E, Reid CN, McHale AP. Optimising ultrasound-mediated gene transfer (sonoporation) in vitro and prolonged expression of a transgene in vivo: potential applications for gene therapy of cancer. Cancer Lett. 2009;273:62–69. - PubMed
-
- Tsunoda S, Mazda O, Oda Y, Iida Y, Akabame S, Kishida T, Shin-Ya M, Asada H, Gojo S, Imanishi J, Matsubara H, Yoshikawa T. Sonoporation using microbubble BR14 promotes pDNA/siRNA transduction to murine heart. Biochem. Biophys. Res. Commun. 2005;336:118–127. - PubMed
Publication types
MeSH terms
Substances
Grants and funding
LinkOut - more resources
Full Text Sources
Other Literature Sources
