Review
. 2014 Jan 15;85 Pt 1(0 1):51-63.
doi: 10.1016/j.neuroimage.2013.06.017. Epub 2013 Jun 14.

Diffuse correlation spectroscopy for non-invasive, micro-vascular cerebral blood flow measurement

Affiliations
Review

Diffuse correlation spectroscopy for non-invasive, micro-vascular cerebral blood flow measurement

Turgut Durduran et al. Neuroimage. .

Abstract

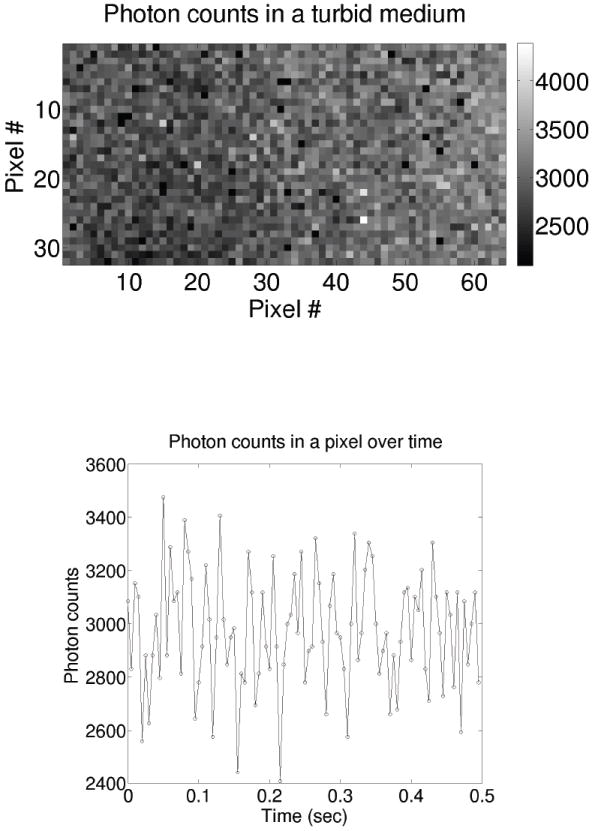
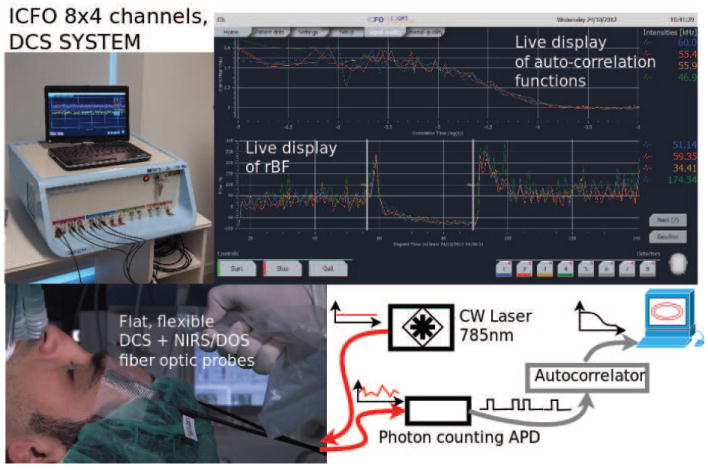
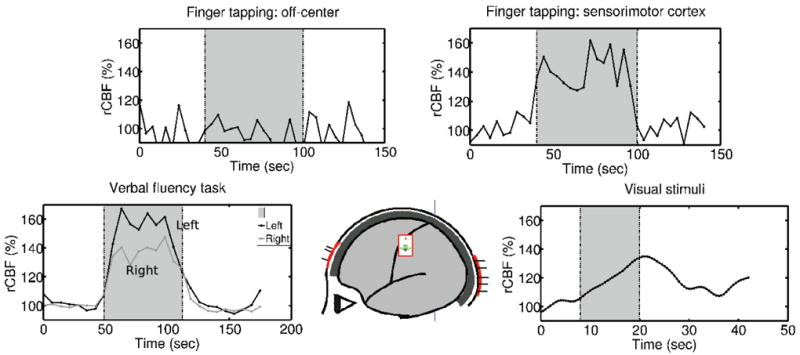
Diffuse correlation spectroscopy (DCS) uses the temporal fluctuations of near-infrared (NIR) light to measure cerebral blood flow (CBF) non-invasively. Here, we provide a brief history of DCS applications in the brain with an emphasis on the underlying physical ideas, common instrumentation and validation. Then we describe recent clinical research that employs DCS-measured CBF as a biomarker of patient well-being, and as an indicator of hemodynamic and metabolic responses to functional stimuli.

Keywords: Cerebral blood flow; Cerebral metabolic rate of oxygen extraction; Diffuse correlation spectroscopy; Diffuse optics; Functional neuroimaging; Ischemic stroke; Near-infrared spectroscopy; Neonatalogy; Neurocritical care.


Conflict of interest statement

disclosures

The authors are co-inventors in patents about DCS/NIRS technologies, but they do not currently receive any royalties. There no other conflicting financial or ethical issues to disclose.

Figures

Figure 1
Figure 1
(Top) A 2D photon-counting camera image showing the spatial variation of the speckles formed due to light emerging from a turbid fluid of “randomly moving” particle-like scatterers. Note, to obtain this image, a point source was placed to the left of the image (outside of the field-of-view), and the speckles are visible despite the apparent decreasing intensity across the image. (Bottom) The time evolution (~ 500μsec exposure/step) of a single pixel (e.g., single speckle) showing the temporal fluctuations of the speckle intensity due to the motion of scatterers in the fluid. The 2D photon-counting camera used here was kindly provided by Alberto Tosi and Franco Zappa of Politecnico di Milano (POLIMI), Italy.
Figure 2
Figure 2
Top left) A modern, portable, clinical DCS system built at the ICFO-Institute of Photonic Sciences in Barcelona, Spain. The light sources and detectors are interfaced to the probes via fiber-optics. (Top right) The graphical user-interface is on a touch screen. Important features in most DCS systems ensure that the autocorrelation functions can be displayed in real-time, and the resultant blood flow index (BFI) is derived and plotted in real-time. (Bottom left) illustrates the elements of a measurement in the surgical unit. Thin probes using 45° cut fiber tips to allow side-firing/collection of the fibers are placed into a probe-pad on the subject’s forehead. Note, here we describe only the DCS component, but in practice the fiber probes also contain fiber optics for NIRS/DOS. (Bottom right) shows a block diagram of the representative instrument. “Red” curves illustrate CW light injection and detection of the intensity fluctuations. “Black” curves indicate digital signals.
Figure 3
Figure 3
Collection of fDCS results from UPENN showing rCBF in response to; (top, left) contralateral finger tapping when the probe is placed away from the sensorimotor cortex, (top right) contralateral finger tapping with the probe placed on the sensorimotor cortex, (bottom left) verbal fluency tasks (bi-lateral), (bottom right) visual stimuli (alternating checkerboard pattern). The shaded area indicates the stimulation period.
Figure 4
Figure 4
The effect of averaging N independent speckles by using N single-mode fibers and N detectors. (Left) The noise predictions from the theory and the experimental results for a single detector compared to N = 28 detectors. (Right) The scaling of the normalized integrated standard deviation as (N). (Dietsche et al., 2007)
Figure 5
Figure 5
DCS vs TCD measures of cerebrovascular reactivity (CVR) using acetazolamide (ACZ). (Top) The averaged (over subjects and hemispheres) ACZ-induced macro-vascular CBFV (measured in middle-cerebral arteries by TCD) and micro-vascular CBF (measured in frontal poles by DCS) in the healthy control subject population. (Center) Signals from a 58 year old patient with occlusion of the left internal carotid artery (ICA) who had a transient ischemic attack of the left ICA two years prior to the measurement. Monitoring shows impairment of CVR in the left hemisphere. Both TCD and DCS exhibit similar results. (Bottom) Signals from a 63 year old patient with left ICA occlusion and who had a right MCA stroke 6 months prior to the measurement. Despite the occlusion, the micro-vascular CVR (i.e., measured by DCS) is preserved, while the macro-vascular CVR is impaired on the right hemisphere. In all panels, the first set of solid vertical bars indicate the time period within which ACZ was injected. The last two vertical bars indicate the time period used for CVR quantification.
Figure 6
Figure 6
Cerebral hemodynamic changes during carotid endarterectomy (CEA) measured by DCS and NIRS/DOS were measured using bilateral probes as shown in the Tio panel. EEG probes (not shown) were placed in standard locations. (Middle) rCBF derived from the cerebral hemisphere ipsilateral to the clamped artery (ICA). (Bottom) rCBF derived from the cerebral hemisphere contralateral to the clamped artery. Courtesy of Guoqiang Yu, U. Kentucky.
Figure 7
Figure 7
“Subject 1” shown by black lines is a typical subject. In these subjects, the peri-infarct side (“x”, continuous black line) has shown a significantly greater change in rCBF in comparison to the contralateral side (“o”, dashed black line) in response to the lowering of the HOB angle. “Subject 2” (light gray lines) represents about ~25% of the subjects, where we have observed that CBF decreased greatly in the peri-infarct side (“x”, continuous gray line) as opposed to the contralateral side (“o”, dashed gray line) in response to the lowering of the HOB position. Note that 0° was repeated twice.
Figure 8
Figure 8
The comparison of absolute BFI (Left) and rCBF measured by DCS (Right) to that of time-domain NIRS/DOS using ICG as a flow tracer. Courtesy of Keith St Lawrence, U. Western Ontario

References

    1. Ackerson BJ, Dougherty RL, Reguigui NM, Nobbman U. Correlation transfer: Application of radiative transfer solution methods to photon correlation problems. J Thermophys and Heat Trans. 1992;6:577–588.
    1. Arridge SR, Schotland JC. Optical tomography: forward and inverse problems. Inverse Problems. 2009;25(12):123010.
    1. Baker WB, Rodgers Z, Cai K, Buckley EM, Greenberg JH, Durduran T, Yodh AG, Reddy R. SPIE Photonics West. San Francisco, CA: 2013. Monitoring changes in the cerebral metabolic rate of oxygen consumption with diffuse optical and mri suspectometry techniques in a pig model; pp. 8578–115.
    1. Baker WB, Sun Z, Hiraki T, Putt ME, Durduran T, Reivich M, Yodh AG, Greenberg JH. Neurovascular coupling varies with level of global cerebral ischemia in a rat model. J Cereb Blood Flow Metab. 2012;33(1):97–105. - PMC - PubMed
    1. Barnett H, Taylor D, Eliasziw M, Fox A, Ferguson G, Haynes R, Rankin R, Clagett G, Hachinski V, Sackett D, et al. Benefit of carotid endarterectomy in patients with symptomatic moderate or severe stenosis. New England Journal of Medicine. 1998;339(20):1415–1425. - PubMed

Publication types