Comparative Study
. 2013 Aug;16(8):1146-53.
doi: 10.1038/nn.3428. Epub 2013 Jun 16.

The effects of neural gain on attention and learning

Affiliations
Comparative Study

The effects of neural gain on attention and learning

Eran Eldar et al. Nat Neurosci. 2013 Aug.

Abstract

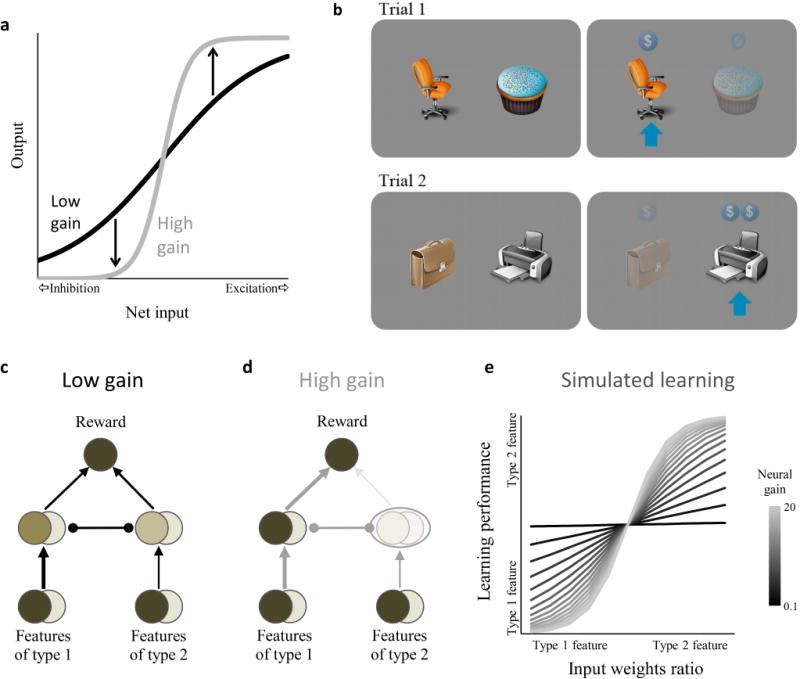
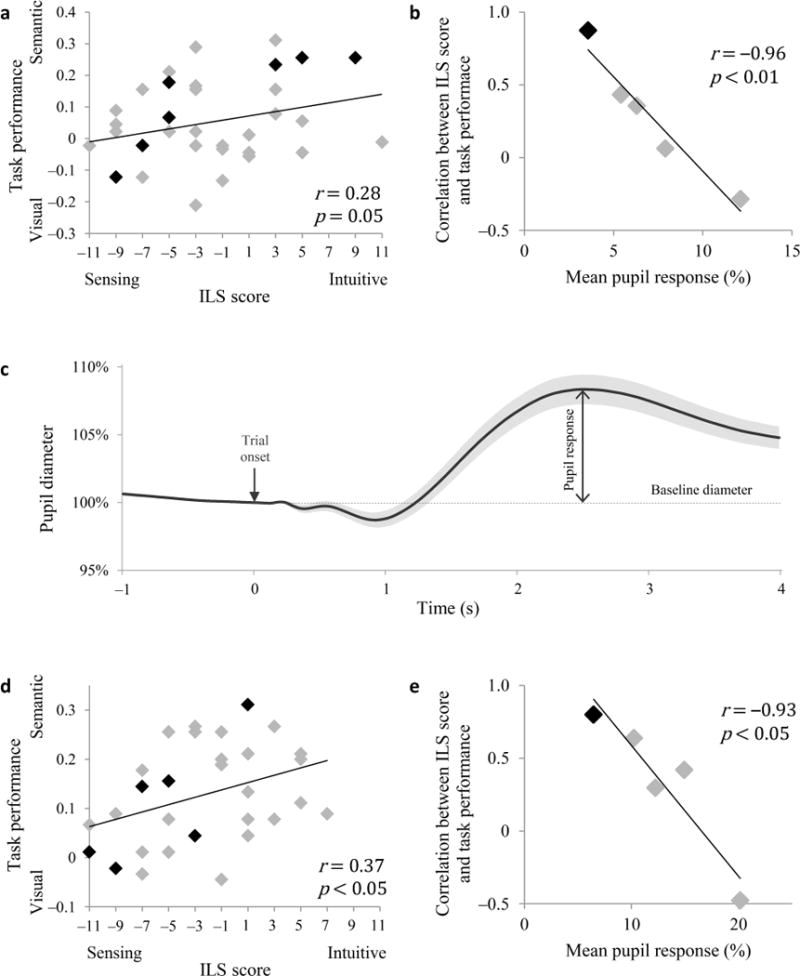
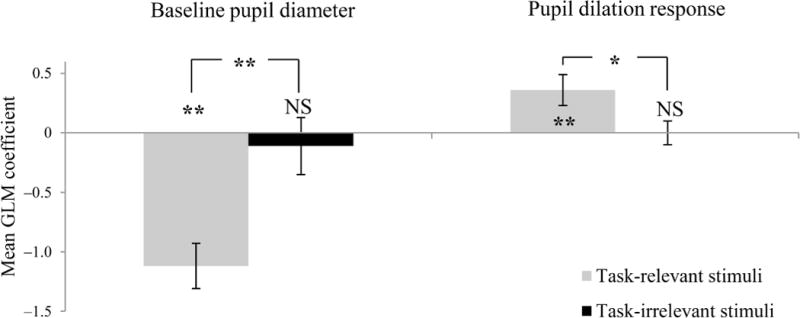
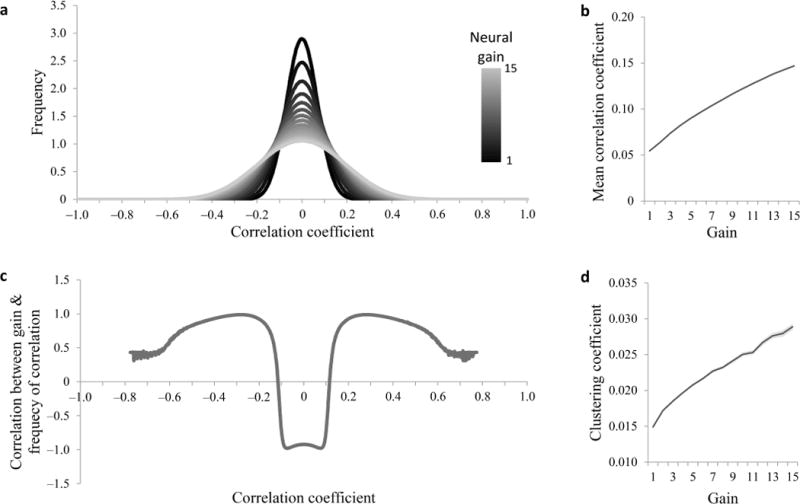
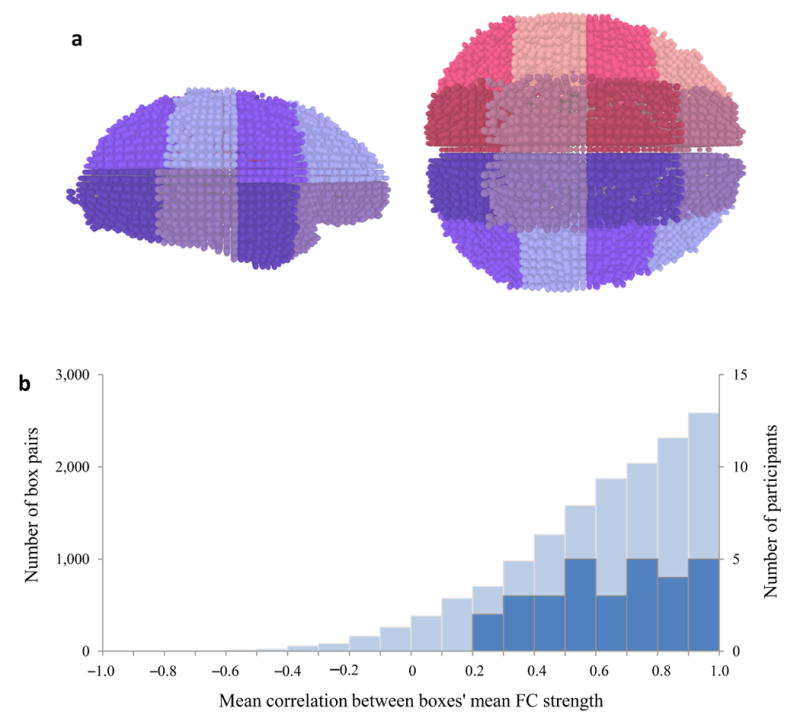
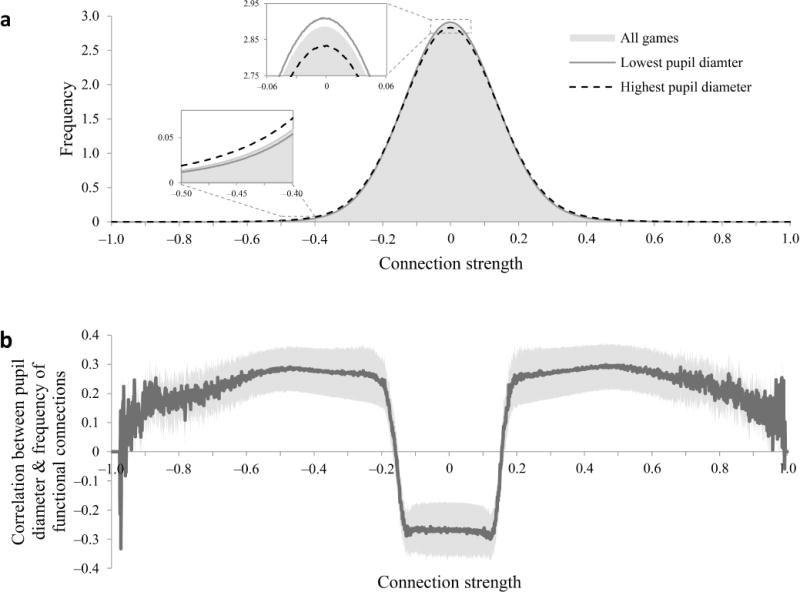
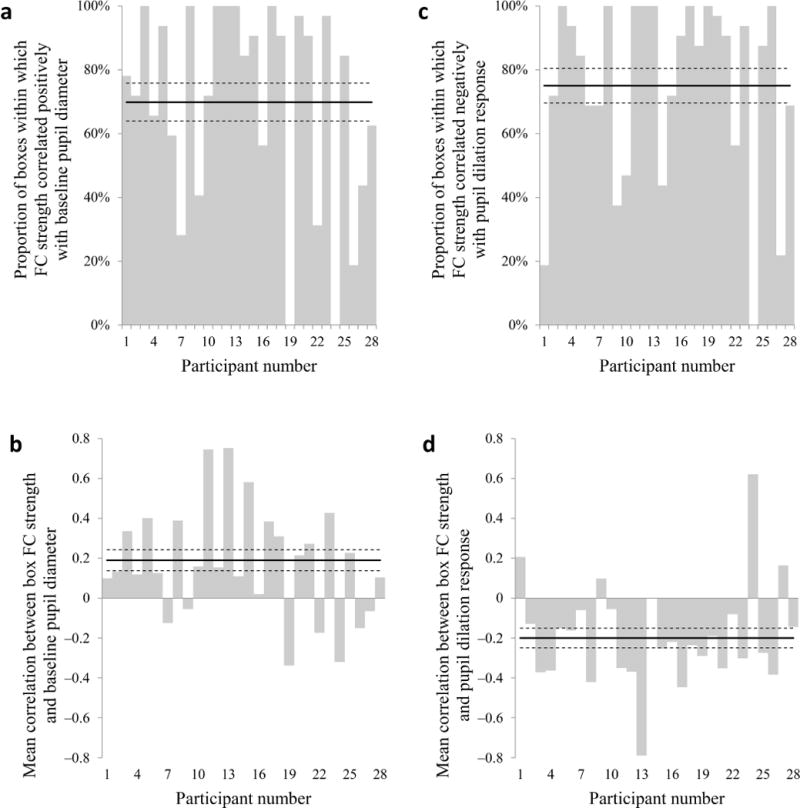
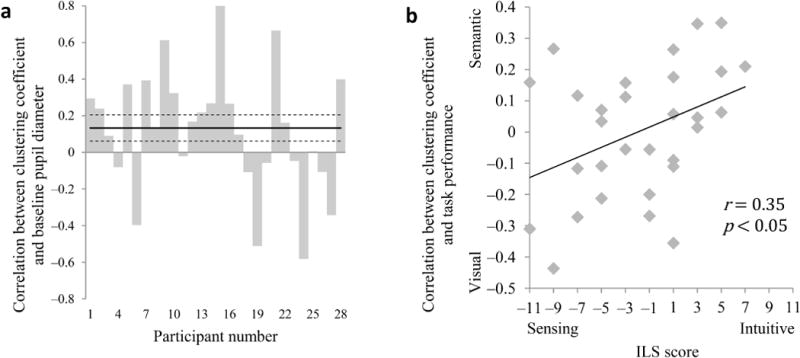
Attention is commonly thought to be manifest through local variations in neural gain. However, what would be the effects of brain-wide changes in gain? We hypothesized that global fluctuations in gain modulate the breadth of attention and the degree to which processing is focused on aspects of the environment to which one is predisposed to attend. We found that measures of pupil diameter, which are thought to track levels of locus coeruleus norepinephrine activity and neural gain, were correlated with the degree to which learning was focused on stimulus dimensions that individual human participants were more predisposed to process. In support of our interpretation of this effect in terms of global changes in gain, we found that the measured pupillary and behavioral variables were strongly correlated with global changes in the strength and clustering of functional connectivity, as brain-wide fluctuations of gain would predict.


Figures

Figure 1
Figure 1
The effect of gain on attention and learning. (a) Input-output function of a neuron with low and high gain. High gain amplifies the effect of input on output, causing stronger excitation and inhibition. (b) Experimental design of the visual/semantic learning task. In each trial, participants were presented with a choice between two images (objects or words). Participants were rewarded according to their choices, with counterfactual rewards also displayed. In this particular game, to maximize reward participants had to learn by trial and error that office-related images provide a higher reward than food-related images (semantic features), and that grayscale images provide a higher reward than color images (visual features). Each trial involved two new stimuli. (c,d) Simple reward-learning neural network. Arrows denote excitatory connections, round edges denote inhibitory connections. Darker fill color indicates more activity and thicker lines indicate stronger weights in examples with low (c) and high (d) gain. With high gain, activity of weakly represented features (type 2) is blocked at the middle layer (circled), so the mapping between type 2 features and reward cannot be learned. This condition effectively separates the second input stream from the rest of the network. (e) Simulated learning of mapping between the reward-predicting features and reward. The relative strength of learning for the two features is shown as a function of the ratio between the input weights (varied between 1/2 and 2/1), for different levels of gain. The higher the gain, the more learning performance depends on the relative weight of each input stream.
Figure 2
Figure 2
Relationship between learning performance and ILS scores. (a) Difference in learning about semantic and visual features in the behavioral experiment as a function of sensing-intuitive score on ILS questionnaire. Negative values indicate better visual performance (Y axis) and a sensing learning style (X axis), while positive values indicate better semantic performance and an intuitive learning style. n = 35. (b) Correlation between ILS sensing-intuitive score and visual-semantic performance difference on the task (as shown in a), as a function of mean pupil dilation response. To examine the degree to which task performance matched ILS score in participants with different levels of pupil response, participants were divided into 5 bins according to mean pupil dilation. Each data point represents a group of 7 participants. To illustrate, data points from the individual members of the group with lowest mean pupil response appear in black in a. (c) Pupil diameter normalized by its value at trial onset (time 0), averaged within participants across trials, and then across participants (lighter shade: s.e.m. across participants; n = 28). Pupil dilation response was computed as the difference between the peak pupil diameter during the 4 s that followed trial onset and the pre-trial baseline diameter, normalized by the pre-experiment resting diameter. As expected, baseline pupil diameter and pupil response were anticorrelated in all participants (mean r = −0.77, range −0.89 to −0.54, t27 = −28.9, p < 10−21). While baseline diameter is thought to be a more direct indicator of tonic LC-NE function, the normalized pupil dilation response can serve as an inverse index that is comparable between individuals. (d,e) Replication of behavioral results in the fMRI experiment with a different group of participants. n = 30. (e) Each data point represents a group of 6 participants.
Figure 3
Figure 3
Relationship between pupil diameter and BOLD response to task-relevant and task-irrelevant stimuli. High baseline pupil dilation was associated with a weaker response to task-relevant stimuli compared to task-irrelevant stimuli, whereas high pupil dilation response was associated with a stronger response to task-relevant stimuli compared to task-irrelevant stimuli. n = 28, *: p < 0.05, **: p < 10−4, errors bars: between subject s.e.m.
Figure 4
Figure 4
Simulation of the effect of global changes in gain on functional connectivity strength and clustering. Recurrent neural networks were composed of 1000 fully connected units with random connection weights. Unit-to-unit correlations were computed across 500 trials for each level of gain, for each of 100 networks. (a) Distribution of correlation coefficients for each of 15 different levels of gain. Higher gain results in stronger functional connections (correlations or anti-correlations). (b) Mean correlation coefficient increases as a function of gain. s.e.m. is too small to observe. Different simulations, in which each unit was only connected to a minority of other units (10%), or in which correlations were measured between the mean activity of groups of 10 units, yielded qualitatively similar results. This suggests that our results are robust to network density and measurement granularity. (c) Correlation between the global gain parameter and the frequency of correlation coefficients as a function of correlation coefficient. Stronger correlations are more prevalent (and weaker correlations are less prevalent) when gain is higher. (d) Clustering coefficient of the networks’ functional connectivity graphs as a function of gain. Clustering coefficient tended to increase with gain. Ligher shade: s.e.m.
Figure 5
Figure 5
Global fluctuations in local functional connectivity. (a) 3D rendering of one participant’s gray-matter voxels divided into 32 boxes, viewed from the right and from above. Each sphere represents a voxel. Adjacent boxes are denoted in different colors. Voxel division is visualized using custom-made software created in the Processing programming environment. (b) Histogram of between-box correlations of mean within-box functional connectivity strength (light blue, left Y axis), and of participants’ mean correlation values (dark blue, right Y axis).
Figure 6
Figure 6
Pupil diameter and whole-brain functional connectivity. (a) Distribution of functional connections by connection strength (n = 28). The distribution is shown separately for all games (gray shading), for the third of each participant’s games in which the participant’s baseline pupil diameter was lowest (solid line), and for the third of games in which pupil diameter was highest (dashed line). Insets: magnification of boxed areas to show differences between lowest and highest pupil diameter games. (b) Game-by-game correlation between baseline pupil diameter and frequency of functional connectivity measurements as a function of functional connectivity value (n = 28). The Y axis indicates whether large pupil diameter was associated with more (positive values) or fewer (negative values) voxel pairs for which functional connectivity strength is indicated on the X axis. For each participant, we computed the distribution of functional connections during each game, and then computed the correlation across games between baseline pupil diameter and the number of voxel pairs in each bin of the distribution. The curve shows the correlations averaged over participants with s.e.m. indicated by the lighter shading. Larger pupil diameter was associated with more strong functional connectivity measurements (absolute strength > 0.17) and fewer weak functional connectivity measurements (between −0.17 and +0.17).
Figure 7
Figure 7
Pupil diameter and local functional connectivity. (a, c) Proportion of boxes within which mean functional connectivity strength was positively correlated with baseline pupil diameter (a) or negatively correlated with pupil dilation response (c) for each participant. (b, d) Mean correlation between within-box functional connectivity strength and baseline pupil diameter (b) or pupil dilation response (d) for each participant. Solid horizontal line: group means, dashed horizontal lines: s.e.m.
Figure 8
Figure 8
The clustering of functional connections, pupil diameter and task performance. (a) Game-by-game correlation between clustering coefficient and baseline pupil diameter by participant. n = 28. (b) Game-by-game correlation between clustering coefficient and visual-semantic performance difference in task as a function of sensing-intuitive score on the ILS questionnaire. n = 30.

Comment in

Similar articles

Cited by

References

    1. Felder RM, Silverman LK. Learning and teaching styles in engineering education. J Eng Educ. 1988;78:674–681.
    1. Coffield F, Moseley D, Hall E, Ecclestone K. Learning Styles and Pedagogy in Post-16 Learning: A Systematic and Critical Review. Learning and Skills Research Centre; London: 2004.
    1. Felder RM, Spurlin J. Application, Reliability and Validity of the Index of Learning Styles. Education. 2005;21:103–112.
    1. Servan-Schreiber D, Printz H, Cohen JD. A network model of catecholamine effects: gain, signal-to-noise ratio, and behavior. Science. 1990;249:892–895. - PubMed
    1. Aston-Jones G, Cohen JD. An integrative theory of locus coeruleus-norepinephrine function: adaptive gain and optimal performance. Annu Rev Neurosci. 2005;28:403–450. - PubMed

Publication types

LinkOut - more resources