Meta-Analysis
. 2013 Aug;45(8):868-76.
doi: 10.1038/ng.2652. Epub 2013 Jun 16.

Genome-wide association study identifies multiple risk loci for chronic lymphocytic leukemia

Sonja I Berndt  1 Christine F SkibolaVijai JosephNicola J CampAlexandra NietersZhaoming WangWendy CozenAlain MonnereauSophia S WangRachel S KellyQing LanLauren R TerasNilanjan ChatterjeeCharles C ChungMeredith YeagerAngela R Brooks-WilsonPatricia HartgeMark P PurdueBrenda M BirmannBruce K ArmstrongPierluigi CoccoYawei ZhangGianluca SeveriAnne Zeleniuch-JacquotteCharles LawrenceLaurie BurdetteJeffrey YuengerAmy HutchinsonKevin B JacobsTimothy G CallTait D ShanafeltAnne J NovakNeil E KayMark LiebowAlice H WangKarin E SmedbyHans-Olov AdamiMads MelbyeBengt GlimeliusEllen T ChangMartha GlennKaren CurtinLisa A Cannon-AlbrightBrandt JonesW Ryan DiverBrian K LinkGeorge J WeinerLucia CondePaige M BracciJacques RibyElizabeth A HollyMartyn T SmithRebecca D JacksonLesley F TinkerYolanda BenaventeNikolaus BeckerPaolo BoffettaPaul BrennanLenka ForetovaMarc MaynadieJames McKayAnthony StainesKari G RabeSara J AchenbachCeline M VachonLynn R GoldinSara S StromMark C LanasaLogan G SpectorJose F LeisJulie M CunninghamJ Brice WeinbergVicki A MorrisonNeil E CaporasoAaron D NormanMartha S LinetAnneclaire J De RoosLindsay M MortonRichard K SeversonElio RiboliPaolo VineisRudolph KaaksDimitrios TrichopoulosGiovanna MasalaElisabete WeiderpassMaría-Dolores ChirlaqueRoel C H VermeulenRuth C TravisGraham G GilesDemetrius AlbanesJarmo VirtamoStephanie WeinsteinJacqueline ClavelTongzhang ZhengTheodore R HolfordKenneth OffitAndrew ZelenetzRobert J KleinJohn J SpinelliKimberly A BertrandFrancine LadenEdward GiovannucciPeter KraftAnne KrickerJenny TurnerClaire M VajdicMaria Grazia EnnasGiovanni M FerriLucia MiligiLiming LiangJoshua SampsonSimon CrouchJu-Hyun ParkKari E NorthAngela CoxJohn A SnowdenJosh WrightAngel CarracedoCarlos Lopez-OtinSilvia BeaItziar SalaverriaDavid Martin-GarciaElias CampoJoseph F Fraumeni JrSilvia de SanjoseHenrik HjalgrimJames R CerhanStephen J ChanockNathaniel RothmanSusan L Slager
Affiliations
Meta-Analysis

Genome-wide association study identifies multiple risk loci for chronic lymphocytic leukemia

Sonja I Berndt et al. Nat Genet. 2013 Aug.

Abstract

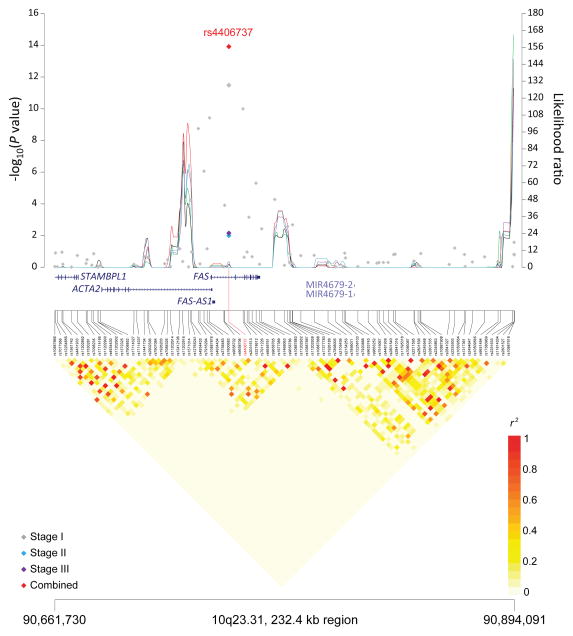
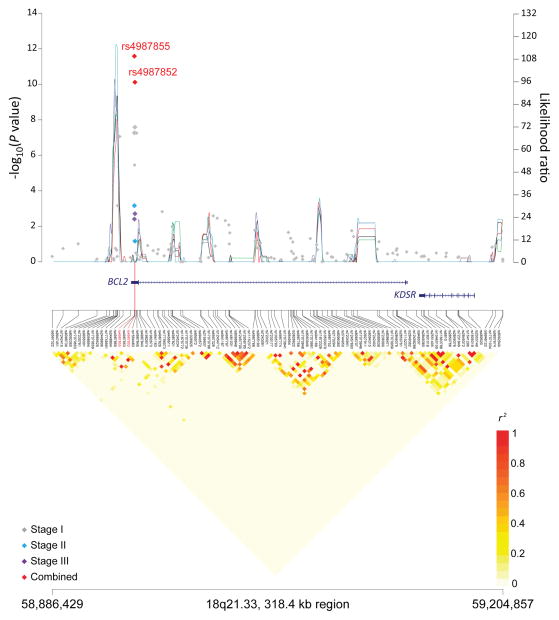
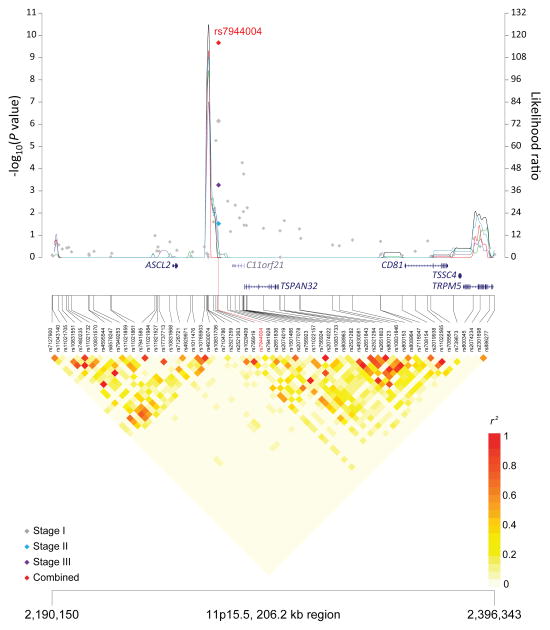
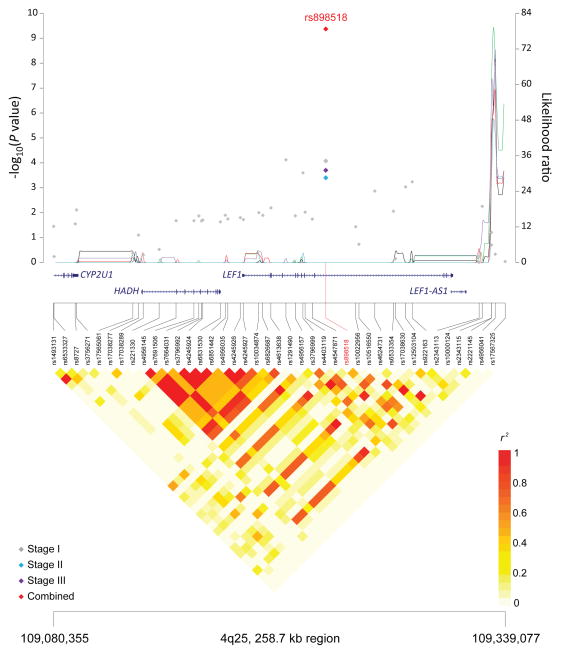
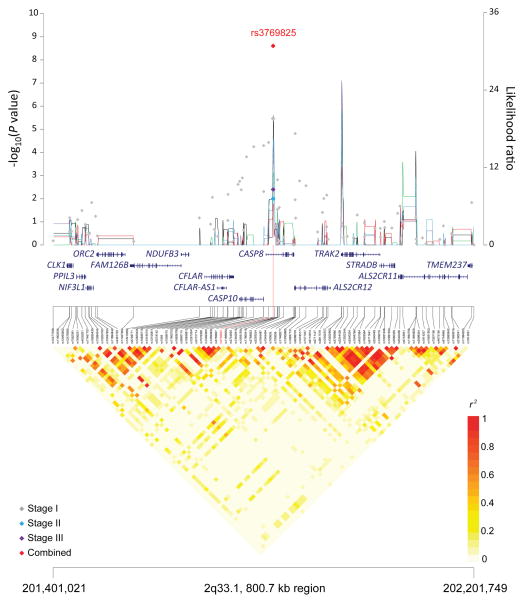
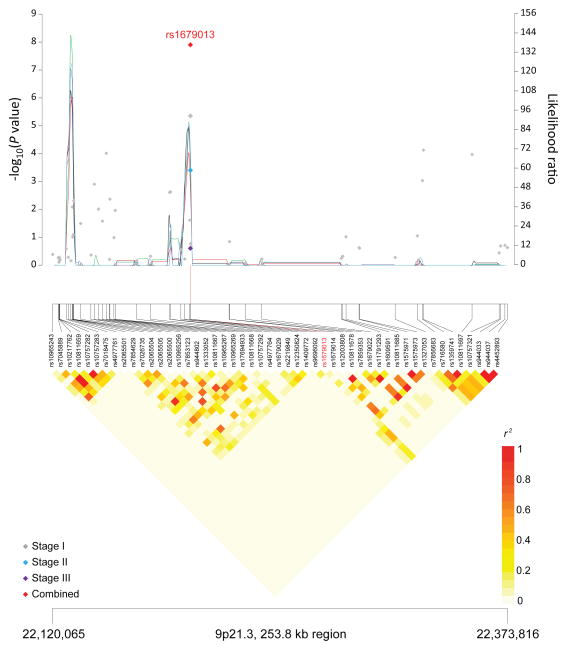
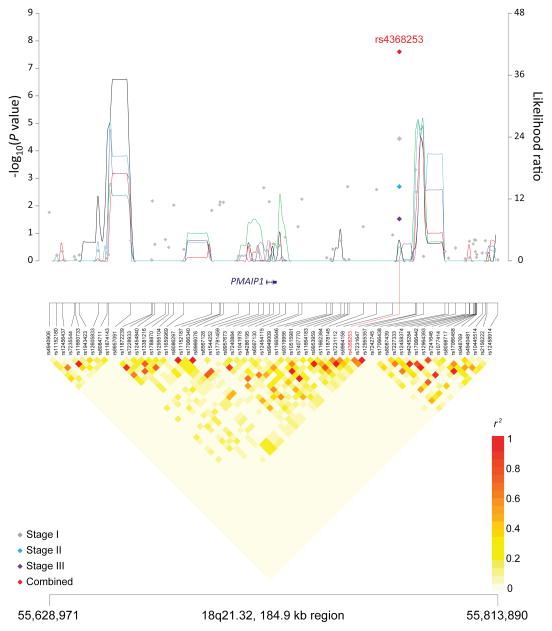
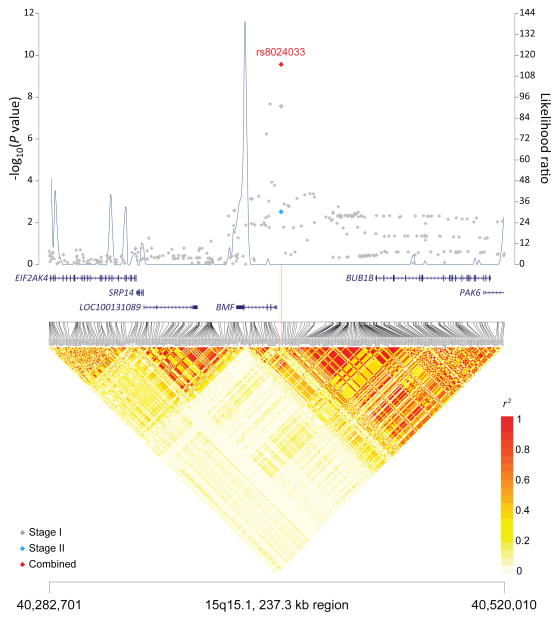
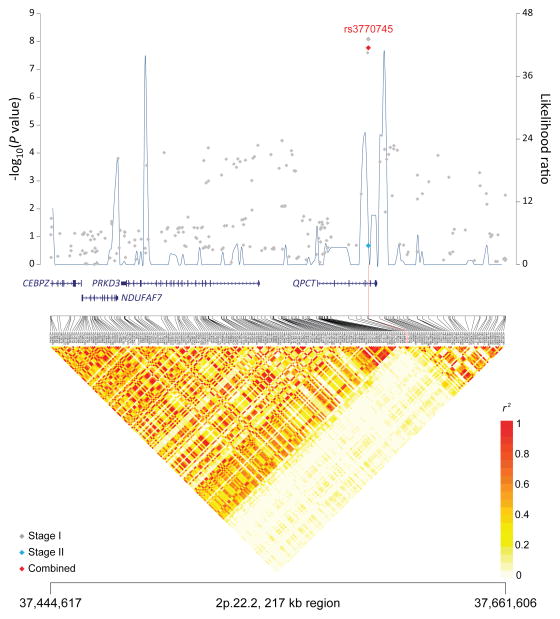
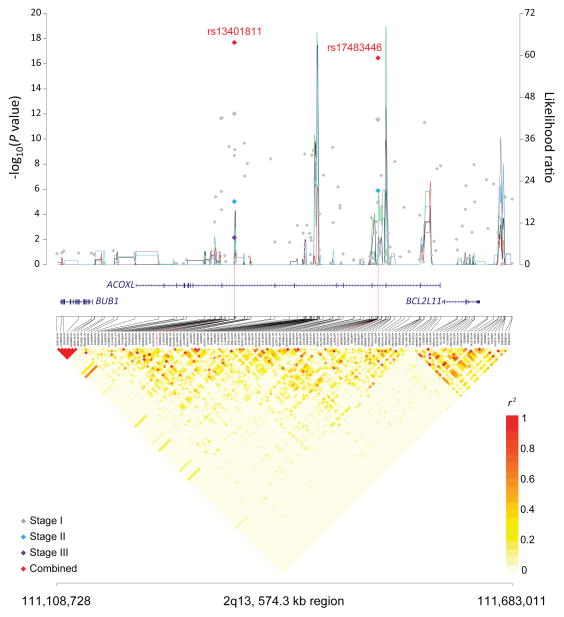
Genome-wide association studies (GWAS) have previously identified 13 loci associated with risk of chronic lymphocytic leukemia or small lymphocytic lymphoma (CLL). To identify additional CLL susceptibility loci, we conducted the largest meta-analysis for CLL thus far, including four GWAS with a total of 3,100 individuals with CLL (cases) and 7,667 controls. In the meta-analysis, we identified ten independent associated SNPs in nine new loci at 10q23.31 (ACTA2 or FAS (ACTA2/FAS), P=1.22×10(-14)), 18q21.33 (BCL2, P=7.76×10(-11)), 11p15.5 (C11orf21, P=2.15×10(-10)), 4q25 (LEF1, P=4.24×10(-10)), 2q33.1 (CASP10 or CASP8 (CASP10/CASP8), P=2.50×10(-9)), 9p21.3 (CDKN2B-AS1, P=1.27×10(-8)), 18q21.32 (PMAIP1, P=2.51×10(-8)), 15q15.1 (BMF, P=2.71×10(-10)) and 2p22.2 (QPCT, P=1.68×10(-8)), as well as an independent signal at an established locus (2q13, ACOXL, P=2.08×10(-18)). We also found evidence for two additional promising loci below genome-wide significance at 8q22.3 (ODF1, P=5.40×10(-8)) and 5p15.33 (TERT, P=1.92×10(-7)). Although further studies are required, the proximity of several of these loci to genes involved in apoptosis suggests a plausible underlying biological mechanism.


Conflict of interest statement

COMPETING INTERESTS

The authors declare no competing financial interests

Figures

Figure 1
Figure 1. Association results, recombination hot-spots, and linkage disequilibrium (LD) plots for the regions newly associated with CLL
Top, association results of GWAS data from Stage 1 NHL-GWAS (grey diamonds), Stage 2 combined data (blue diamond), Stage 3 combined data (purple diamond), and Stages 1–3 combined data (red diamond) are shown in the top panel with −log10(P) values (left y axis). Overlaid are the likelihood ratio statistics (right y axis) to estimate putative recombination hotspots across the region on the basis of 5 unique sets of 100 randomly selected control samples. Bottom, LD heatmap based on r2 values from total control populations for all SNPs included in the GWAS. (a) 10q23.31 region; (b) 18q21.33 region; (c) 11p15.5 region; (d) 4q25 region; (e) 2q33.1 region; (f) 9p21.3 region; (g) 18q21.32 region; (h) 15q15.1 region; (i) 2p22.2 region.
Figure 2
Figure 2. Association results, recombination hot-spots, and linkage disequilibrium (LD) plot for the new independent CLL susceptibility SNP in the 2q13 established locus
Top, association results of GWAS data from Stage 1 NHL-GWAS (grey diamonds), Stage 2 combined data (blue diamond), Stage 3 combined data (purple diamond), and Stages 1–3 combined data (red diamond) are shown in the top panel with −log10(P) values (left y axis). Overlaid are the likelihood ratio statistics (right y axis) to estimate putative recombination hotspots across the region on the basis of 5 unique sets of 100 randomly selected control samples. Bottom, LD heatmap based on r2 values from total control populations for all SNPs included in the GWAS.

References

    1. Albright F, Teerlink C, Werner TL, Cannon-Albright LA. Significant evidence for a heritable contribution to cancer predisposition: a review of cancer familiality by site. BMC cancer. 2012;12:138. - PMC - PubMed
    1. Goldin LR, Bjorkholm M, Kristinsson SY, Turesson I, Landgren O. Elevated risk of chronic lymphocytic leukemia and other indolent non-Hodgkin’s lymphomas among relatives of patients with chronic lymphocytic leukemia. Haematologica. 2009;94:647–53. - PMC - PubMed
    1. Di Bernardo MC, et al. A genome-wide association study identifies six susceptibility loci for chronic lymphocytic leukemia. Nature genetics. 2008;40:1204–10. - PubMed
    1. Crowther-Swanepoel D, et al. Common variants at 2q37.3, 8q24.21, 15q21.3 and 16q24.1 influence chronic lymphocytic leukemia risk. Nature genetics. 2010;42:132–6. - PMC - PubMed
    1. Slager SL, et al. Genome-wide association study identifies a novel susceptibility locus at 6p21.3 among familial CLL. Blood. 2011;117:1911–6. - PMC - PubMed

Publication types