. 2013 Aug;14(8):785-92.
doi: 10.1038/ni.2631. Epub 2013 Jun 16.

Nucleation of platelets with blood-borne pathogens on Kupffer cells precedes other innate immunity and contributes to bacterial clearance

Affiliations

Nucleation of platelets with blood-borne pathogens on Kupffer cells precedes other innate immunity and contributes to bacterial clearance

Connie H Y Wong et al. Nat Immunol. 2013 Aug.

Abstract

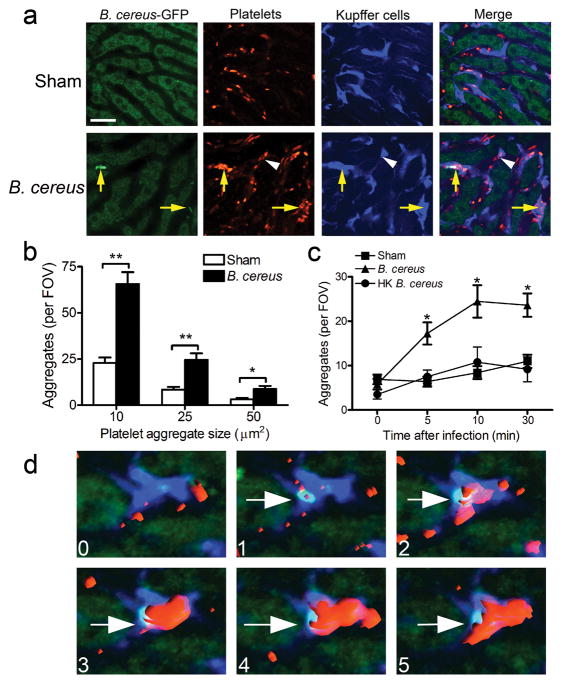
Through the use of intravital imaging of the liver, we demonstrate a collaborative role for platelets with Kupffer cells (KCs) in eradicating blood-borne bacterial infection. Under basal conditions, platelets, via the platelet-adhesion receptor GPIb, formed transient 'touch-and-go' interactions with von Willebrand factor (vWF) constitutively expressed on KCs. Bacteria such as Bacillus cereus and methicillin-resistant Staphylococcus aureus (MRSA) were rapidly caught by KCs and triggered platelets to switch from 'touch-and-go' adhesion to sustained GPIIb-mediated adhesion on the KC surface to encase the bacterium. Infected GPIbα-deficient mice had more endothelial and KC damage than did their wild-type counterparts, which led to more fluid leakage, substantial polycythemia and rapid mortality. Our study identifies a previously unknown surveillance mechanism by which platelets survey macrophages that rapidly converts to a critical host response to blood-borne bacteria.


Conflict of interest statement

COMPETING FINANCIAL INTERESTS

The authors declare no competing financial interests.

Figures

Figure 1
Figure 1. Platelets form “touch-and-go” interactions within the liver sinusoids
(a) Representative intravital microscopy images of wild-type mouse liver. Platelets labeled with PE-conjugated anti-CD49b (red); Kupffer cells labeled with Alexa Fluor 647-conjugated anti-F4/80 (blue). Yellow arrows denote rapid and transient “touch-and-go” behavior of platelets on KC. (b) Quantification of the number of platelet “touch-and-go” interactions with KC or the endothelium within the livers of wild-type, KC-depleted (KC-depl), GpIbα−/− (GPIbα-def) and Cd41-yfpki/ki (CD41-def) mice in basal conditions. n ≥ 3 individual mice per group; error bars, SEM; *P < 0.01 by one-way ANOVA. (c) Quantification of the total number of platelet “touch-and-go” interactions within the livers of wild-type, KC-depleted, GpIbα−/− (GPIbα-def) and Cd41-yfpki/ki (CD41-def) mice in basal conditions. n ≥ 3 individual mice per group; error bars, SEM; *P < 0.01; **P < 0.001 by one-way ANOVA. (d) Quantification of the total number of platelet “touch-and-go” interactions within the livers, brain, muscle, skin and ear of wild-type in basal conditions. n ≥ 3 individual mice per group; error bars, SEM; *P < 0.001 vs Liver, one-way ANOVA. See also Supplementary Video 1.
Figure 2
Figure 2. Systemic thrombocytopenia after B. cereus infection
(a) Circulating platelet counts from sham wild-type mice and mice intravenously infected with 5 × 10⁷ CFU B. cereus for 4 h. n ≥ 6 individual mice per group; error bars, SEM; *P < 0.001 by t test. (b) Survival rate of B. cereus-infected wild-type mice treated with control (Ctrl) or platelet depletion serum (Platelet-depl). n ≥ 10 per group. *P < 0.001. (c) Bacteriological analysis of liver, spleen and lung of wild-type mice at 1 and 4 h after B. cereus infection. n ≥ 4 individual mice per group; error bars, SEM; *P < 0.001, t test. (d) Bacteriological analysis of peripheral blood of wild-type mice treated with control (Ctrl) or platelet depletion serum (Platelet-depl) at 1 and 4 h after B. cereus infection.. n ≥ 10 per group; error bars, SEM; *P < 0.01, t test.
Figure 3
Figure 3. Platelets aggregate after B. cereus infection in vivo
(a) Representative intravital microscopy images of livers from mice intravenously infected with 5 × 10⁷ CFU B. cereus for 10 min. Platelets labeled with PE-conjugated anti-CD49b (red); Kupffer cells labeled with Alexa Fluor 647-conjugated anti-F4/80 (blue). Yellow arrows denote colocalization of B. cereus and platelet aggregates. White arrowhead denotes platelet aggregation independent of B. cereus. Scale bar, 25 μm. (b) Quantification of the number of platelet aggregates per field of view (FOV) within liver sinusoids that were larger than 10, 25 and 50 μm2 following sham or 10 min post B. cereus infection. n ≥ 4 individual mice per group; error bars, SEM; *P < 0.05; **P < 0.01 by t test. (c) Quantification of the number of platelet aggregates per FOV within liver sinusoids that were larger than 25 μm2 following sham, live B. cereus, or heat-killed (HK) B. cereus. n ≥ 4 individual mice per group; error bars, SEM; *P < 0.05 by one-way ANOVA. (d) Representative 3-D sequential images showing KC (blue) captures B. cereus (green) and initiates platelet aggregation (red) within liver sinusoids during the first 5 min post infection in vivo. The numbers in each panel represents minutes after infection. White arrows denote the captured B. cereus by KC within liver sinusoids. See also Supplementary Video 2.
Figure 4
Figure 4. Platelets aggregate after MRSA infection in vivo
(a) Quantification of the number of platelet aggregates per field of view (FOV) within liver sinusoids that were larger than 25 μm2 following sham, Methicillin-susceptible S. aureus (MSSA; Xen29) or Methicillin-resistant S. aureus (MRSA; USA300) infection in wild-type mice. n ≥ 4 individual mice per group; error bars, SEM; *P < 0.05 by one-way ANOVA. (b) Representative 3-D reconstructed images showing KC (blue) captures green MSSA (left panel) or MRSA (right panel) and initiates platelet aggregation (red) within liver sinusoids after 10 min of infection in vivo. Yellow arrows denote the captured bacteria by KC within liver sinusoids. (c) Survival rate of MSSA or MRSA-infected wild-type mice treated with control (Ctrl) or platelet depletion serum (Platelet-depl). n ≥ 9 per group. *P < 0.01.
Figure 5
Figure 5. Kupffer cells capture of B. cereus is required for platelet aggregation
(a) Representative intravital microscopy images of livers from untreated mice (UT) or treated with clondronate liposomes (CLL) to deplete KCs in vivo. Kupffer cells labeled with PE-conjugated anti-F4/80 (red) and endothelium labeled with Alexa Fluor 647-conjugated anti-PECAM (blue). Scale bar, 50 μm. (b) The number of B. cereus bacteria that were captured within liver sinusoids after 10 min of infection were counted in wild-type, KC-depleted (KC-depl) and C3−/− (C3-def) mice. n ≥ 4 individual mice per group; error bars, SEM; *P < 0.01 by one-way ANOVA. (c) Quantification of the number of platelet aggregates per FOV within liver sinusoids that were larger than 25 μm2 following sham or B. cereus infection in wild-type and KC-depleted mice. n ≥ 4 individual mice per group; error bars, SEM; *P < 0.05 by one-way ANOVA. (d) Quantification of the number of platelet aggregates within liver sinusoids that were larger than 25 μm2 following sham or B. cereus infection in wild-type and C3−/− (C3-def) mice. n ≥ 4 individual mice per group; error bars, SEM; *P < 0.05 by one-way ANOVA. See also Supplementary Video 3.
Figure 6
Figure 6. GPIb and GPIIb mediate platelet aggregation after B. cereus infection
(a) Quantification of the number of platelet aggregates per FOV within liver sinusoids that were larger than 25 μm2 following sham or following 10 min of B. cereus infection in wild-type (WT) and GpIbα−/− (GPIbα-def) mice. n ≥ 4 individual mice per group; error bars, SEM; *P < 0.05 by t test. (b) The area of vWF staining within liver sinusoids was quantified in sham and mice infected with B. cereus for 10 min. n ≥ 5 individual mice per group; error bars, SEM; *P < 0.05 by t test. (c) Representative intravital microscopy images of livers from sham and B. cereus-infected mice treated with PE-conjugated anti-rabbit vWF (red) at 10 min. Kupffer cells labeled with Alexa Fluor 647-conjugated anti-F4/80 (blue). Scale bar, 50 μm. (d) Quantification of the number of platelet aggregates per FOV within liver sinusoids that were larger than 25 μm2 following sham or B. cereus infection in wild-type and mice that were pretreated with anti-vWF blocking Ab. n ≥ 4 individual mice per group; error bars, SEM; *P < 0.05 by one-way ANOVA. (e) Quantification of the number of platelet aggregates per FOV within liver sinusoids that were larger than 25 μm2 following sham (opened) or B. cereus infection (closed) in wild-type (WT; squares) and Cd41-yfpki/ki (CD41-def; circles) mice. n ≥ 4 individual mice per group; error bars, SEM; *P < 0.05 by one-way ANOVA.
Figure 7
Figure 7. Platelet aggregation following B. cereus infection is protective to the host
(a) Survival rate of B. cereus-infected wild-type (WT) and GpIbα−/− (GPIbα-def) mice. n ≥ 10 per group. *P < 0.001. (b) Bacteriological analysis of peripheral blood of surviving wild-type (WT) and GpIbα−/− (GPIbα-def) mice at 1 and 4 h after B. cereus infection. n ≥ 10 per group; error bars, SEM; *P < 0.05 by t test. (c) Liver damage of sham and B. cereus-infected wild-type (WT) and GpIbα−/− (GPIbα-def) mice at 4 h was measured via plasma concentrations of alanine transaminase (ALT). n ≥ 6 individual mice per group; error bars, SEM; *P < 0.05 by two-way ANOVA. (d) Quantification of the area of propidium iodide-positive staining within the livers of wild-type (WT) and GpIbα−/− (GPIbα-def) mice following sham or B. cereus infection at 4 h. n ≥ 4 individual mice per group; error bars, SEM; *P < 0.01 by two-way ANOVA. (e) Representative intravital microscopy images of livers from wild-type (WT) and GpIbα−/−(GPIbα-def) mice intravenously infected with 5 × 10⁷ CFU B. cereus for 4 h. Necrotic cells labeled with propidium iodide (red); Kupffer cells labeled with Alexa Fluor 647-conjugated anti-F4/80 (blue). Scale bar, 50 μm. (f) The hematocrit of the peripheral blood was measured following sham or B. cereus infection in wild-type (WT) and GpIbα−/− (GPIbα-def) mice at 4 h. n ≥ 6 individual mice per group; error bars, SEM; *P < 0.001 by two-way ANOVA. (g) To assess KC function, inert microspheres were administered intravenously after 4 h of B. cereus infection. The number of microspheres captured by KCs per FOV after 10 min was counted. n ≥ 4 individual mice per group; error bars, SEM; *P < 0.01 by two-way ANOVA. (h) The lungs of sham and B. cereus-infected wild-type (WT) and GpIbα−/− (GPIbα-def) mice at 4 h were removed and assayed for neutrophil infiltration, as measured by MPO activity. n ≥ 6 individual mice per group; error bars, SEM; *P < 0.01 by two-way ANOVA.

Comment in

References

    1. Crispe IN. The liver as a lymphoid organ. Annu Rev Immunol. 2009;27:147–163. - PubMed
    1. Katz S, Jimenez MA, Lehmkuhler WE, Grosfeld JL. Liver bacterial clearance following hepatic artery ligation and portacaval shunt. J Surg Res. 1991;51:267–270. - PubMed
    1. Rabinovitch M. Professional and non-professional phagocytes: an introduction. Trends Cell Biol. 1995;5:85–87. - PubMed
    1. Kobayashi SD, et al. Rapid neutrophil destruction following phagocytosis of Staphylococcus aureus. J Innate Immun. 2010;2:560–575. - PMC - PubMed
    1. Pang YY, et al. agr-Dependent interactions of Staphylococcus aureus USA300 with human polymorphonuclear neutrophils. J Innate Immun. 2010;2:546–559. - PMC - PubMed

Publication types

MeSH terms

Substances