

Factors affecting crowded acuity: eccentricity and contrast
- PMID: 23770657
- PMCID: PMC3837536
- DOI: 10.1097/OPX.0b013e31829908a4
Factors affecting crowded acuity: eccentricity and contrast
Abstract
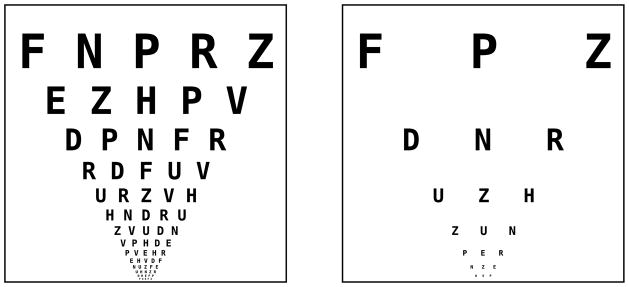
Purpose: Acuity measurement is a fundamental method to assess visual performance in the clinic. Little is known about how acuity measured in the presence of neighboring letters, as in the case of letter charts, changes with contrast and with nonfoveal viewing. This information is crucial for acuity measurement using low-contrast charts and when patients cannot use their fovea. In this study, we evaluated how optotype acuity, with and without flankers, is affected by contrast and eccentricity.
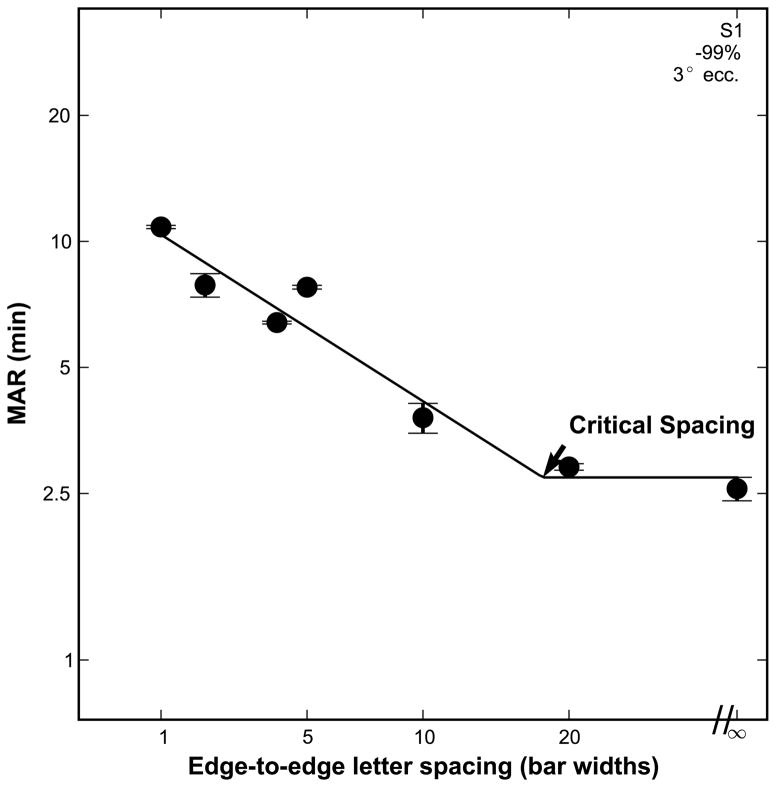
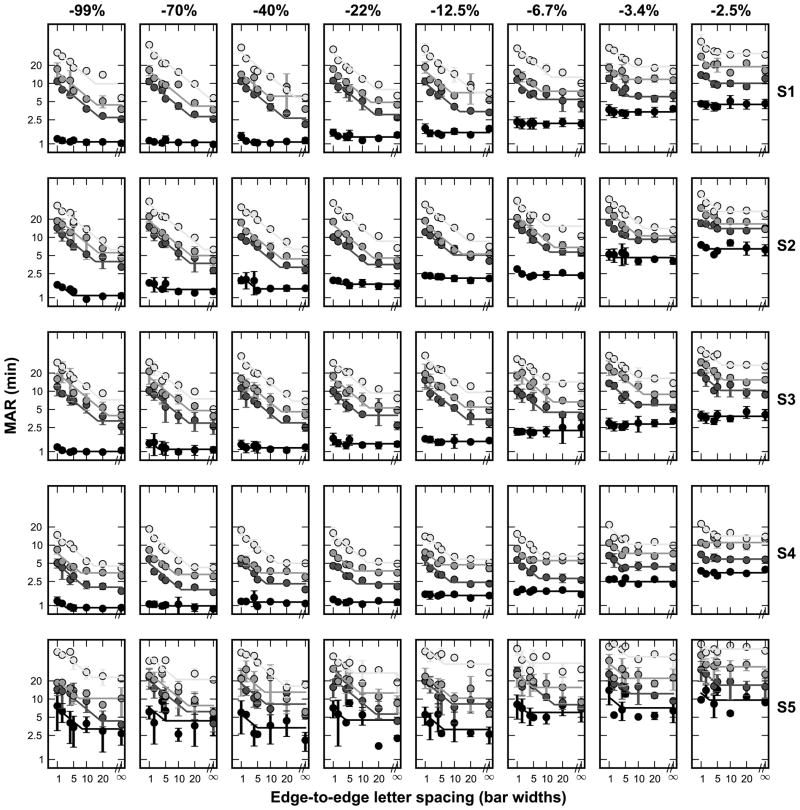
Methods: Five young adults with normal vision identified the orientation of a Tumbling-E presented alone or in the presence of four flanking Tumbling-Es. Edge-to-edge letter spacing ranged from 1 to 20 bar widths. Stimuli were presented on a white background for 150 ms with Weber contrast ranging from -2.5% to -99%. Flankers had the same size and contrast as the target. Testings were performed at the fovea, 3°, 5°, and 10° in the inferior visual field.
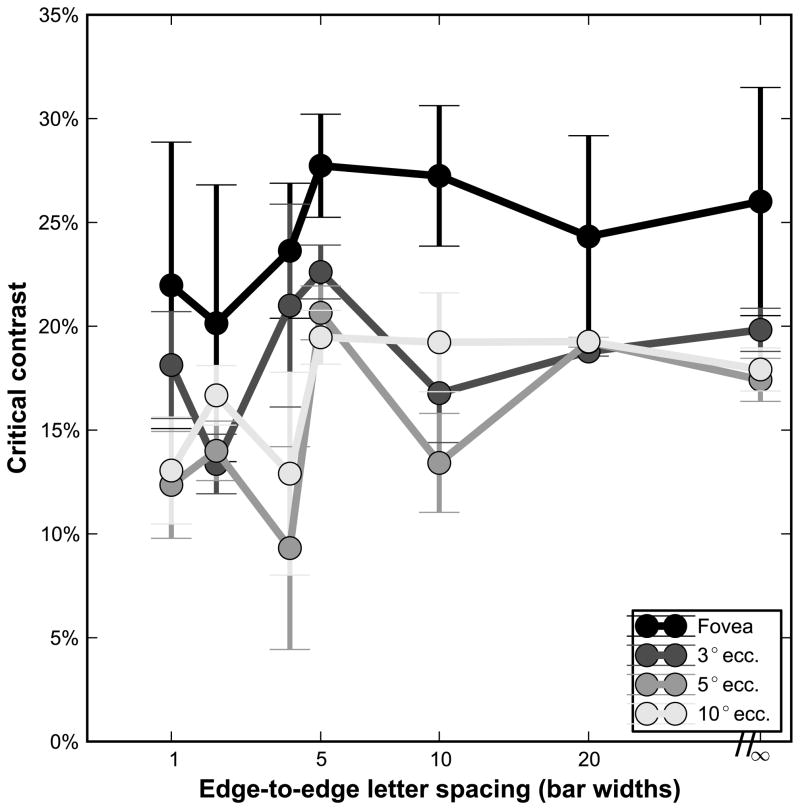
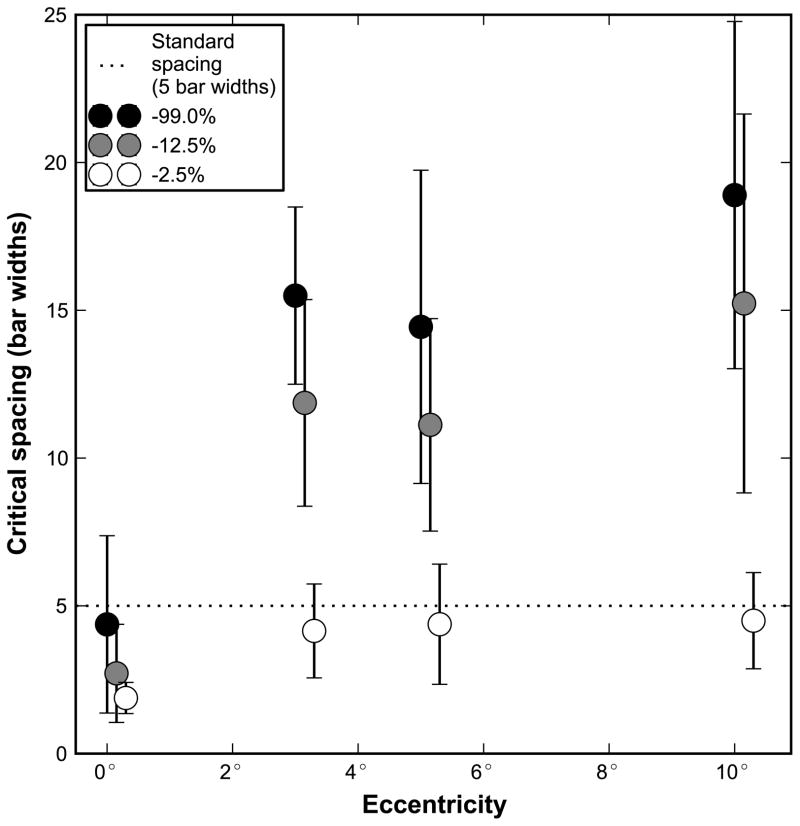
Results: When plotted as a function of letter spacing, acuity remains unaffected by the presence of flankers until the flankers are within the critical spacing, which averages an edge-to-edge spacing of 4.4 bar widths at the fovea and approximately 16 bar widths at all three eccentricities. Critical spacing decreases with a reduction in contrast. When plotted as a function of contrast, acuity only worsens when the contrast falls below approximately 24% at the fovea and 17% in the periphery, for flanked and unflanked conditions alike.
Conclusions: The letter spacing on conventional letter charts exceeds the critical spacing for acuity measurement at the fovea, at all contrast levels. Thus, these charts are appropriate for assessing foveal acuity. In the periphery, the critical spacing is larger than the letter spacing on conventional charts. Consequently, these charts may underestimate the acuity measured in the periphery because of the effects of crowding.
Figures
References
-
- Bailey IL. Perspective: visual acuity-keeping it clear. Optom Vis Sci. 2012;89:1247–8. - PubMed
-
- Bailey IL, Lovie JE. New design principles for visual acuity letter charts. Am J Optom Physiol Opt. 1976;53:740–5. - PubMed
-
- Ferris FL, 3rd, Kassoff A, Bresnick GH, Bailey I. New visual acuity charts for clinical research. Am J Ophthalmol. 1982;94:91–6. - PubMed
-
- Hyvärinen L, Näsänen R, Laurinen P. New visual acuity test for pre-school children. Acta Ophthalmol (Copenh) 1980;58:507–11. - PubMed
-
- McGraw PV, Winn B, Gray LS, Elliott DB. Improving the reliability of visual acuity measures in young children. Ophthalmic Physiol Opt. 2000;20:173–84. - PubMed
Publication types
MeSH terms
Grants and funding
LinkOut - more resources
Full Text Sources
Other Literature Sources
