. 2013 Jul;15(7):763-72.
doi: 10.1038/ncb2772. Epub 2013 Jun 16.

Chase-and-run between adjacent cell populations promotes directional collective migration

Affiliations

Chase-and-run between adjacent cell populations promotes directional collective migration

Eric Theveneau et al. Nat Cell Biol. 2013 Jul.

Abstract

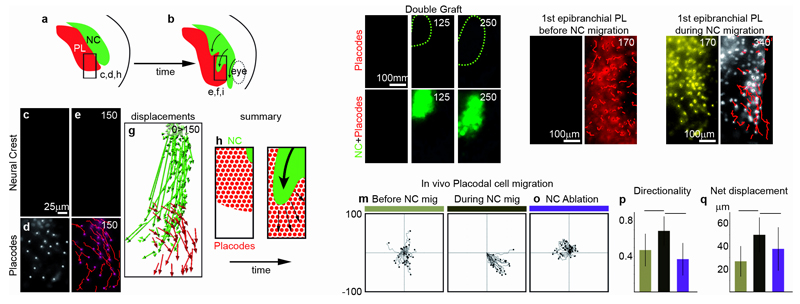
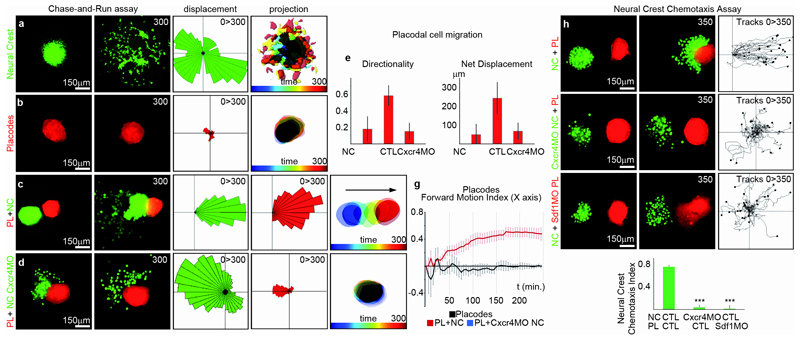
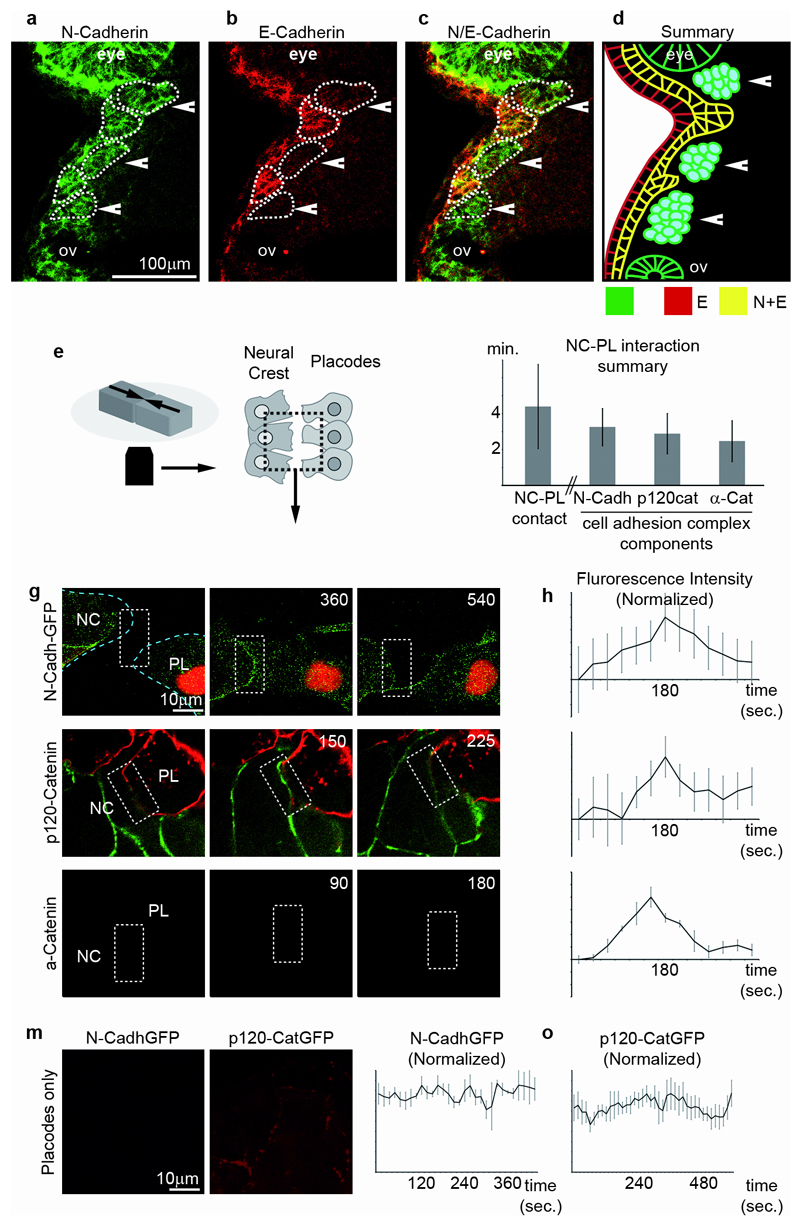
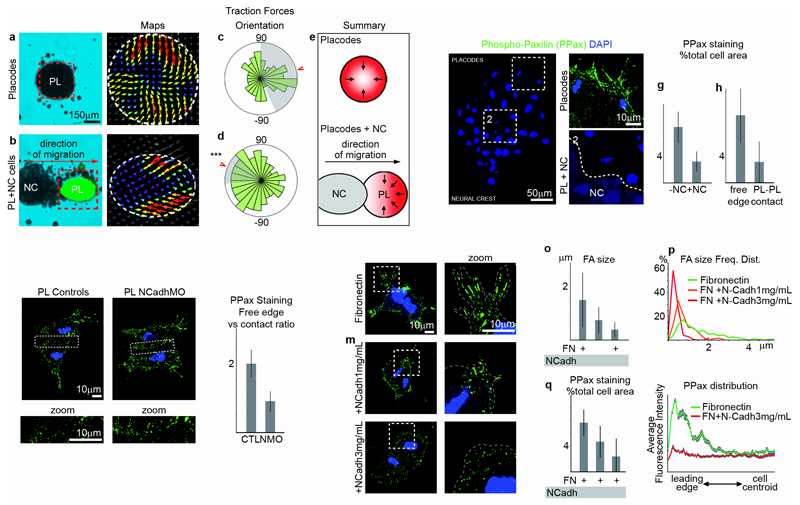
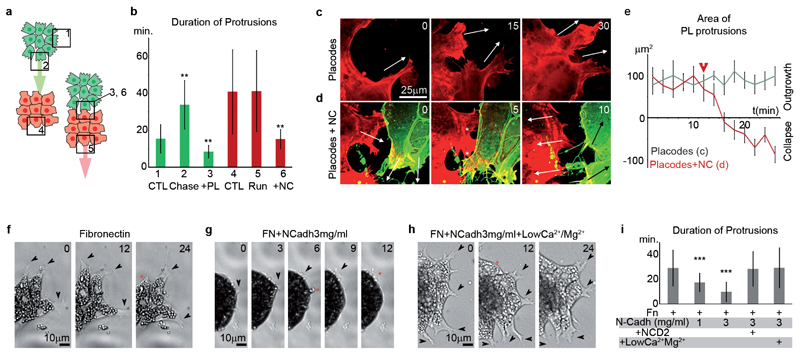
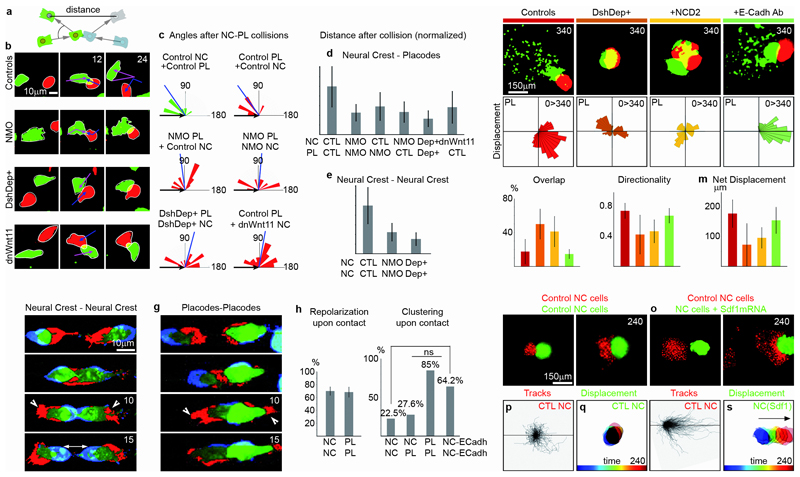
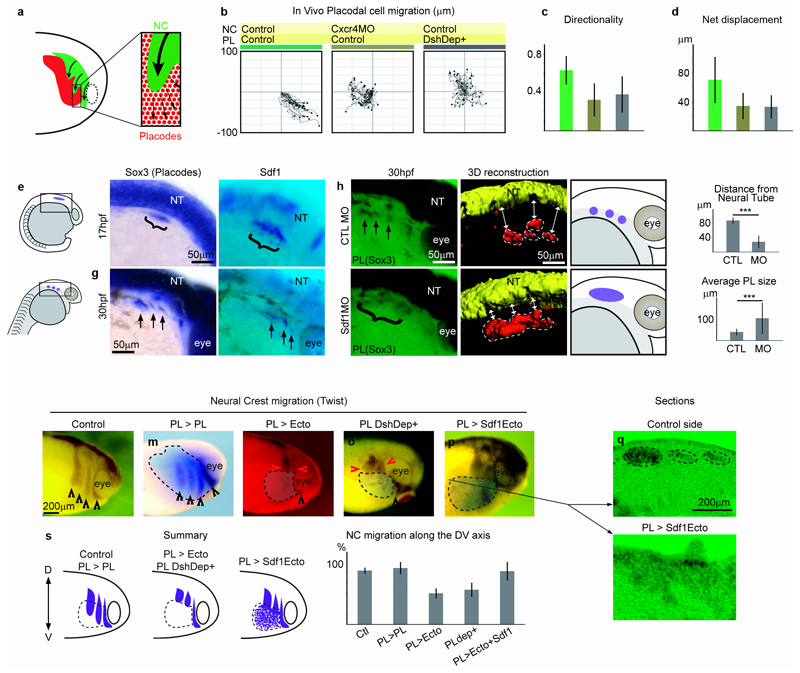
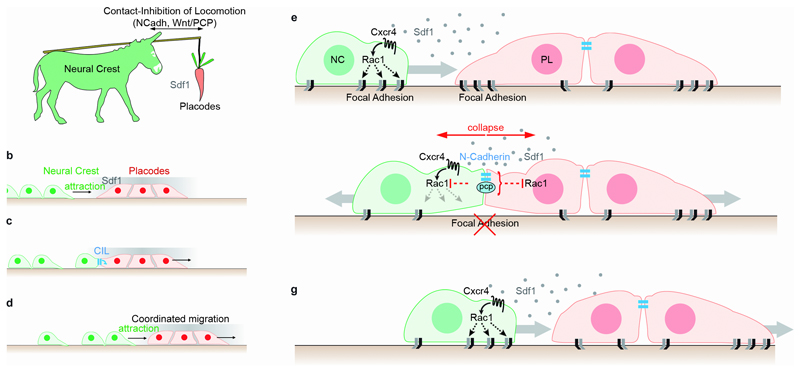
Collective cell migration in morphogenesis and cancer progression often involves the coordination of multiple cell types. How reciprocal interactions between adjacent cell populations lead to new emergent behaviours remains unknown. Here we studied the interaction between neural crest (NC) cells, a highly migratory cell population, and placodal cells, an epithelial tissue that contributes to sensory organs. We found that NC cells chase placodal cells by chemotaxis, and placodal cells run when contacted by NC. Chemotaxis to Sdf1 underlies the chase, and repulsion involving PCP and N-cadherin signalling is responsible for the run. This chase-and-run requires the generation of asymmetric forces, which depend on local inhibition of focal adhesions. The cell interactions described here are essential for correct NC migration and for segregation of placodes in vivo and are likely to represent a general mechanism of coordinated migration.


Conflict of interest statement

Competing Financial Interests

The authors declare no competing financial interests.

Figures

Figure 1
Figure 1. Neural Crest cell migration triggers directional movement of placodal cells.
(a-b) NC and placodes are located into adjacent domains (diagram made after Snail2 and Eya1 expression patterns at stages 16 and 21). The region monitored in time-lapse movies is delimited by a square and corresponds to the precursors of the first epibranchial placode located ventrally to the second NC stream. (c-f) In vivo cell migration of NC from the second stream (c, e) and placodal from the first epibranchial placode (d, f). Cells were labelled with nuclear-mCherry prior to the graft. (g) Displacement maps of the cells shown in c to f. (h-i) Diagram proposing that placodal cells (red) move away when NC cells (green) migrate ventrally. (j) Stills from an in vivo time-lapse movie showing that NC migration (green) actually leads to the formation of gaps in the placodal region (red). (k-l) Stills from time-lapse movies showing the movement of placodes before (k) and during NC migration (l). (m-o) Tracks of placodal cells from time-lapse movies before NC migration, during NC migration or after NC ablation. (p-q) Directionality and net displacement extracted from tracks shown in f (n=3 independent experiments, one-way ANOVA, P<0.0001; individual comparisons **, p<0.01, error bars: sd). Time is in minutes.
Figure 2
Figure 2. Chase-and-run: Neural Crest and Placodes undergo Sdf1-dependent coordinated collective migration.
(a) Control NC explants cultured on Fibronectin. (b) Control placodal cells cultured on Fibronectin. (c) Co-culture of control NC and placodes. (d) Co-culture of placodes and Cxcr4MO-NC cells. (a-d) Displacement maps and time projection are shown for each culture condition. (e-f) Placodal cell migration: directionality and net displacement (n=3 independent experiments, one-way ANOVA, P<0.0001, individual comparisons; **, p<0.01; error bars: sd). (g) Placode directionality along the x axis plotted against time; nPL+NC=10 independent experiments; nPL= 5 independent experiments; nPL+Cxcr4MO NC= 9 independent experiments; error bars: sem). (h-k) Neural Crest chemotaxis assay with control NC (h), Cxcr4MO-NC cells (i) and Sdf1MO-NC cells (j). Tracks from 3 independent experiments (one-way ANOVA P<0.0001; individual comparisons ***, p<0.001; error bars: sd).
Figure 3
Figure 3. Neural Crest and placodes form transient, but functional, adherens junctions.
(a-d) Double immunostatining for N- and E-Cadherin on histological sections through the cephalic regions of Xenopus embryos at stage 25. N-Cadherin (a) is expressed in NC (arrowheads) and epibranchial placodes (asterisks) as well as the eye and the otic vesicle (ov). E-Cadherin (b) is expressed only in epibranchial placodes and the superficial ectoderm. (c) Merged picture of the green and red channels. (d) Summary of cadherins distribution in NC and placodes. (e) Diagram representing the experimental set-up. (f) From left to right: duration of individual NC-placodes contact at the interface between the two tissues during the chase-and-run; duration of N-Cadherin, p120-catenin and alpha-catenin accumulations during NC-placodes physical contacts (data collected from 3 independent experiments, error bars: sd). (g-l) Dynamics of the formation of transient adherens junctions between NC and placodes. (g, i, k) Confocal images. (g) NC and placodes express N-Cadherin-GFP. (i) NC cells express p120-Catenin-GFP, placodes are labelled with membrane-mCherry. (k) NC cells express alpha-Catenin-GFP, placodes are labelled with membrane-mCherry. (h, j, l) Variation of fluorescence intensity over time of GFP-bound molecules shown in (g, i, k); after background subtraction and normalization. Average from 5 independent cell-cell junctions (error bars: sem). (m-o) Localization and dynamics of N-Cadherin-GFP (m-n) and p120-Catenin-GFP (m, o) between placodal cells. Average from from 4 independent cell-cell junctions, error bars: sem.
Figure 4
Figure 4. Neural Crest-Placodal interaction leads to asymmetric traction forces and inhibition of focal adhesions.
(a-e) Traction forces in placodal cells alone (a, n=3 independent experiments) or in contact with NC cells (b; n=4 independent experiments; placodes are identified by green fluorescence). (c-d) Overall orientation of traction forces in placodal cells alone (c, n= 3210 angles from 3 independent experiments) or in contact with NC cells (d, n= 2925 angles from 4 independent experiments). Arrowhead indicates mean angle, grey shows the standard deviation. Orientation of forces in placodes in contact with NC cells is significantly different than a uniform circular distribution (Rayleigh’s, plot c, P= 0.338; plot d, P= 0.0059(***)). (e) Summary of a-d. (f) PhosphoPaxillin (PPax) immunostaining (green) on NC (Red) and placodal cells, nuclei are blue (DAPI). Dotted lines mark the areas that are magnified (Inset 1: border opposite to the contact; Inset 2: contact with NC). (g-h) PPax staining as a percentage of the total cell area (panel g, n=4 independent experiments, Mann-Whitney test, p= 0.0095(**), error bars: sd; panel h, n=3 independent experiments; Mann-Whitney test: p<0.0001(***), error bars: sd). (i-k) PPax immunostaining in control placodes and NCadhMO placodes, n=6 independent experiments; Mann-Whitney test: p=0.0012(**), error bars: sd. (l-n) PPax immunostaining (green) in placodal cells cultured on Fn (l), Fn+1μg/mL of N-Cadherin (m) or Fn+3μg/mL of N-Cadherin (n). Nuclei are in blue (DAPI). Dotted lines mark the regions that are magnified (second column). (o) Average size of the focal adhesions (n=3 independent experiments; non-parametric ANOVA (Kruskal-Wallis), p<0.0001; individual comparisons; ***, p<0.001; error bars: sd). (p) Frequency distribution of the sizes of focal adhesion shown in o (542 focal adhesions from 3 independent experiments). (q) Quantification of PPax staining shown in f. Total area of PPax staining as a percentage of the total cell area (n=5 independent experiments; ANOVA, p<0.0001; individual comparisons; *, p<0.05; **, p<0.01; error bars: sd). (r) Distribution of the average fluorescence intensity of PPax staining in placodal cells on Fn (ncells=8; 4 series of 50 measurements per cell) and Fn+3μg/mL of N-Cadherin (ncells=9, 4 series of 50 measurements per cell). Error bars: sem.
Figure 5
Figure 5. N-Cadherin-dependent contacts lead to cell protrusion instability.
(a-b) Duration of protrusions in NC and placodal cells cultured alone or in contact with each other. Numbers shown for each bar in b correspond to the different regions indicated by numbered squares in a (Green bars, n=3 independent experiments, ANOVA NC cells, P<0.0001; individual comparisons, **, p<0.01. Red bars, n=5 independent experiments, ANOVA PL cells; P<0.0001, individual comparisons, **, p<0.01; error bars: sd). (c-d) Stills from time-lapse movies performed on a spinning disk confocal microscope. Placodal cells are labelled with lifeAct-mCherry. NC cells are labelled with lifeAct-mCherry and membrane-GFP. Arrows indicate the direction of protrusions when growing or collapsing. Asterisks mark the protrusions that collapse after contact between NC and placodal cells. (e) Over-time variation of protrusion area in placodal cells with or without contact with NC cells (ncells=5, nprotrusions/cell=5 for 12 timepoints each; error bars, sd). Arrowhead indicates the moment of contact between NC and placodal cells. (f-h) Stills from time-lapse movies of placodal cells on Fn (f), Fn+N-Cadherin (g), Fn+N-Cadherin in low Calcium/Magnesium solution (h). Arrowheads indicate stable or growing protrusions. Red asterisks mark collapsing protrusions. (i) Duration of protrusion in placodal cells (n=6 independent experiments; non-parametric ANOVA (Kruskal-Wallis), P<0.0001, individual comparisons, ***, p<0.001). NCD2, blocking antibody against N-Cadherin. Error bars in b, e and s show standard deviation. Time is in minutes.
Figure 6
Figure 6. Coordinated migration of NC and Placodal cells requires contact-inhibition of locomotion.
(a-e) Collisions between single cells. The angle of repolarization (α) and the distance between the two cells are retrieved from the collisions. (b) Collisions between NC cells (green) and placodal cells (red) in control conditions, after blocking N-Cadherin expression (NMO) or Wnt/PCP (DshDep+, dnWnt11). (c) Repolarization angles in all conditions, n=6 independent experiments, Rayleigh’s test pNC=0.00015(***), pPL=0.00028(***), pPLNMO=0.2, pPLNMO+NCNMO=0.2, pPLDep+=0.1085, pPL+NCdnWnt11=0.347, blue bars: mean angle. (d-e) Distance between cell centroids 30 minutes after collision; d, n=6 independent experiments; one-way ANOVA, P<0.0001; individual comparisons; **, p<0.01; error bars: sd; e, n=3 independent experiments; one-way ANOVA: P<0.0001, individual comparisons; **, p<0.01; error bars: sd. (f-g) Collision between two NC cells (f) or two placodes (g). Consecutive frames were subtracted and colour-coded such that protrusions appear red whereas retractions appear blue. (h) Cells repolarizing upon collision (n=360 collisions from 3 independent experiments, error bars: sd). Parametric approach for percentages, two-sided test: T=0.10, α>0.05 (not significant). (i) Cell clustering upon collision (n=142 collisions from 2 independent experiments). Parametric approach for percentages, two-sided test: NC-NC vs NC-PL, T= 0.23, α>0.05 (not significant); NC-NC vs PL-PL, T=21.21, =0.001(***); PL-PL vs NC-Ecadh-NC-ECadh, T=2.99, α>0.05 (not significant); NC-NC vs NC-ECadh-NC-ECadh, T=15.91, α=0.001(***). (j) “Chase-and-run” assay with control NC and placodal cells, after blocking Wnt/PCP (DshDep+), N-Cadherin (NCD2) or E-Cadherin (n=68 chase-an-run assays from 4 independent experiments). Displacements maps show the overall placodal directionality for each condition. (k) Overlap between NC and placodal cells. One-way ANOVA: P<0.005; individual comparisons, **, p<0.01; error bars: sd. (l) Directionality of placodal cells. One-way ANOVA: P<0.01; individual comparisons, *, p<0.05; **, p<0.01; error bars: sd. (m) Net displacement of placodal cells. One-way ANOVA: P<0.01; individual comparisons, *, p<0.05; **, p<0.01; error bars: sd. (n-s) Co-culture of NC explants. (n, p-q) Two control NC explants. (o, r-s) One control explant (green), one overexpressing Sdf1 (red). 10 chase-an-run assays from 2 independent experiments. Tracks from representative examples are provided for the red cells and time projections from representative examples are shown for the green cells. Time is in minutes.
Figure 7
Figure 7. Interaction between NC and Placodes via CIL and chemotaxis is required for placode and Neural Crest migration in vivo.
(a-b) Cell tracking analysis of placodal cells in vivo in controls, after inhibition of chemotaxis in NC cells (Cxcr4MO) or Wnt/PCP in placodal cells (DshDep+) from 3 independent experiments. (c-d) Directionality, (One-way ANOVA: P<0.0001, individual comparisons, **, p<0.01; error bars: sd) and net displacement (One-way ANOVA: P<0.0001, individual comparisons, **, p<0.01; error bars: sd) of placodal cells extracted from the tracks shown in b. (e-k) Zebrafish embryos. (e) Diagrams of the two stages of zebrafish development shown hereafter. (f-g) Sdf1 is expressed in placodal cells (Sox3). (h-i) Placodal cell distribution in an embryo injected with a control MO (h) or Sdf1MO (i) to block NC cell migration (14 animals analyzed, 65% showed a fusion of Placodes). A 3D reconstruction of Sox3 staining in h and i is provided and summarized in diagram. Dotted lines indicate the placodes. White arrows highlight the distance between the placodes and the neural tube. (j) Distance between placodal cells and the neural tube, 19 animals from 3 independent experiments were analyzed; Student’s T-test (two-tailed): ***, p= 9×10⁻⁷; errors bars: sd. (k) Average size of the individual placodal domains, 42 animals from 3 independent experiments were analyzed; ***, Student’s T-test (two-tailed): p= 0.0023; errors bars: sd. (l-t) NC cell migration after interfering with placodes. (l) Control embryo provided for reference. (m) A homotypic, homochronic graft of control placodes. (n) Placodes replaced by a non-placodal Sdf1-negative ectoderm. (o) Placodes replaced by placodes expressing Dsh-Dep+. (p) Placodes replaced by a non-placodal Sdf1-positive ectoderm. Black arrowheads indicate the NC streams migrating normally, the red arrowheads mark NC stream that stopped prematurely. (q-r) Sections of an embryo with a graft similar to that presented in p. (s) Summary of the different treatments presented in l-p. (t) Ratio of NC migration along the dorso-ventral axis on the grafted side versus the control side for l-p, 44 animals from 3 independent experiments were analyzed; one-way ANOVA: P<0.0001; all conditions compared to the first column; **, p<0.01; errors bars: sd.
Figure 8
Figure 8. Contact-Inhibition of Locomotion and Chemotaxis between NC and placodal cells drives coordinated migration of both cell populations.
(a) The overall behaviour of NC and placodal cells is reminiscent of the popular image of the donkey and the carrot where the donkey (NC) is attracted to the carrot (placodes) but the carrot moves away because of the donkey’s progression. (b) NC cells are attracted to placodal cells due to Sdf1-dependent chemotaxis. (c) Contact between NC and placodal cells induces CIL. Protrusions are inhibited in placodal cells at the region of contact with NC cells. This breaks the symmetry of the placodal tissue thus promoting directional movement. (d) The system self-sustains due to chemotaxis and CIL. Sdf1 gradient is shown as shades of grey. NC cells are in green, placodal cells are in red. (e-g) Molecular pathways involved in the chase-and-run between NC and placodes. (e) Sdf1 released by the placodes acts on NC cells promoting an increase in Rac activity, which stabilizes protrusions and focal adhesions. NC moves towards placodes (grey arrow). (f) NC moves forward contacting placode cells and triggering a CIL response in both cell types. A transient cell junction complex is formed (blue), which together with PCP signalling (grey) inhibit Rac activity at the cell contact, leading to collapse of cell protrusions and disassembly of focal adhesions. This localized response within the placode cluster generates an asymmetry which leads to directional migration of the cluster away from NC (grey arrow from placodes). (g) During this “run” phase placodes continue secreting Sdf1 which will attract NC cells (grey arrow from NC), with the consequent coordinated migration of both cell populations.

Comment in

References

    1. Aman A, Piotrowski T. Cell migration during morphogenesis. Dev Biol. 2010;341:20–33. - PubMed
    1. Friedl P, Gilmour D. Collective cell migration in morphogenesis, regeneration and cancer. Nat Rev Mol Cell Biol. 2009;10:445–457. - PubMed
    1. Aman A, Piotrowski T. Cell migration during morphogenesis. Dev Biol. 2009;341:20–33. - PubMed
    1. Tsuji T, Ibaragi S, Hu GF. Epithelial-mesenchymal transition and cell cooperativity in metastasis. Cancer Res. 2009;69:7135–7139. - PMC - PubMed
    1. Le Douarin N, Kalcheim C. The neural crest. Edn 2nd. Cambridge University Press; Cambridge, UK: New York, NY, USA: 1999.

Publication types