. 2013 Aug 8;122(6):863-71.
doi: 10.1182/blood-2013-03-490565. Epub 2013 Jun 14.

Cardiovascular toxicity and titin cross-reactivity of affinity-enhanced T cells in myeloma and melanoma

Affiliations

Cardiovascular toxicity and titin cross-reactivity of affinity-enhanced T cells in myeloma and melanoma

Gerald P Linette et al. Blood. .

Abstract

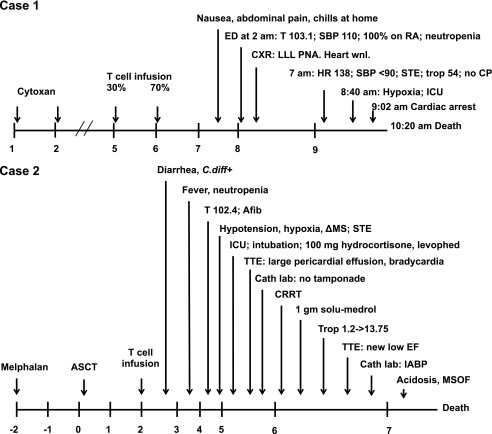
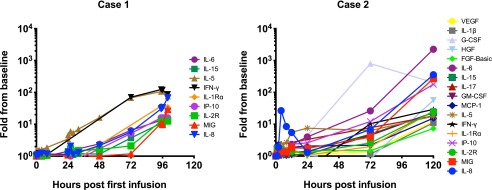
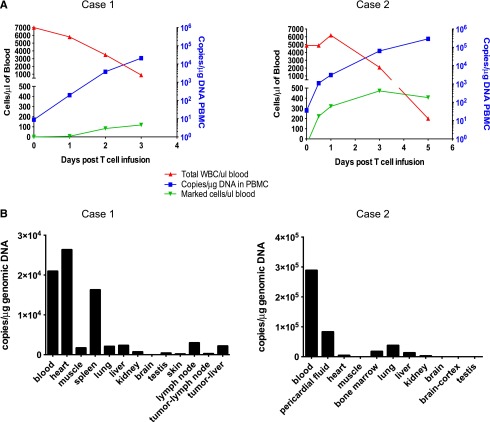
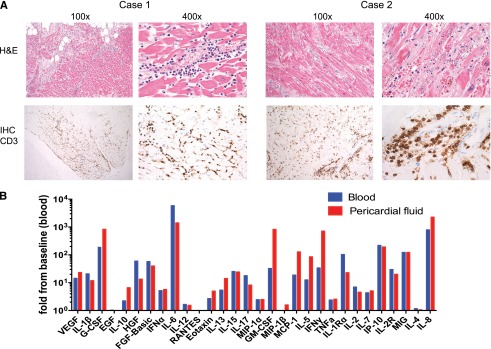
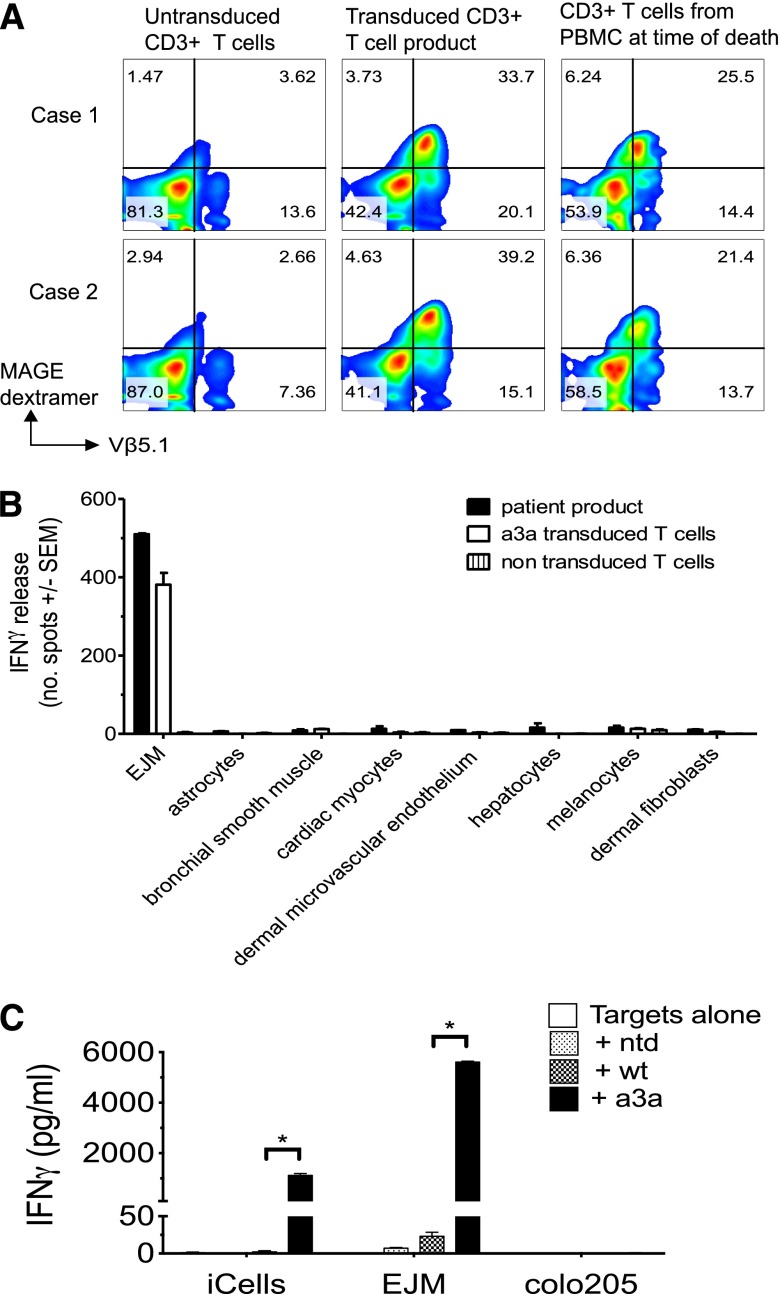
An obstacle to cancer immunotherapy has been that the affinity of T-cell receptors (TCRs) for antigens expressed in tumors is generally low. We initiated clinical testing of engineered T cells expressing an affinity-enhanced TCR against HLA-A*01-restricted MAGE-A3. Open-label protocols to test the TCRs for patients with myeloma and melanoma were initiated. The first two treated patients developed cardiogenic shock and died within a few days of T-cell infusion, events not predicted by preclinical studies of the high-affinity TCRs. Gross findings at autopsy revealed severe myocardial damage, and histopathological analysis revealed T-cell infiltration. No MAGE-A3 expression was detected in heart autopsy tissues. Robust proliferation of the engineered T cells in vivo was documented in both patients. A beating cardiomyocyte culture generated from induced pluripotent stem cells triggered T-cell killing, which was due to recognition of an unrelated peptide derived from the striated muscle-specific protein titin. These patients demonstrate that TCR-engineered T cells can have serious and not readily predictable off-target and organ-specific toxicities and highlight the need for improved methods to define the specificity of engineered TCRs.


Figures

Figure 1
Figure 1
Timeline of events after infusion of engineered T cells. ΔMS, altered mental status; Afib, atrial fibrillation; ASCT, autologous stem cell transplant; Cath laboratory, cardiac catheterization laboratory; CP, chest pain; CRRT, continuous renal replacement therapy; CXR, chest x-ray; ED, emergency department; EF, ejection fraction; HR, heart rate; IABP, intra-aortic balloon pump; ICU, intensive care unit (transfer); LLL, left lower lobe; MSOF, multisystem organ failure; PNA, pneumonia; RA, room air; SBP, systolic blood pressure; STE, ST elevations on electrocardiogram; T, temperature; Trop, troponin; TTE, transthoracic echocardiogram; Wnl, within normal limits. 100% on RA, 100% oxygen saturation on room air by pulse oximetry.
Figure 2
Figure 2
Peripheral blood cytokines elevated in both patients. Peripheral blood samples were collected in both patients at predetermined time points; specific levels of 30 cytokines were quantified and compared with baseline (preinfusion) samples. Only cytokines that were elevated at least 10-fold over baseline at any time point are shown. Case 2 received granulocyte colony-stimulating factor (G-CSF) as part of standard-of-care therapy following the autologous stem cell transplant. Baseline (preinfusion) serum values of the 9 analytes shown in Case 1 were IL-6, 12.5 pg/mL; IL-15, 30.8 pg/mL; IL-5, 1.82 pg/mL; IFN-γ, 1.68 pg/mL; IL-1Rα, 245 pg/mL; interferon-inducible protein 10 (IP-10), 99.9 pg/mL; IL-2R, 322 pg/mL; monokine induced by gamma interferon (MIG/CXCL9), 30.7 pg/mL; and IL-8, 11.6 pg/mL. Baseline levels of all cytokines analyzed in the serum in Case 2 are detailed in the legend for Figure 4B. FGF, fibroblast growth factor; GM-CSF, granulocyte macrophage CSF; HGF, hepatocyte growth factor; MCP-1, monocyte chemoattractant protein 1; VEGF, vascular endothelial growth factor.
Figure 3
Figure 3
Fate of the infused engineered T cells. (A) Expansion of the engineered T cells over time in both patients. Left y-axis shows cell count per microliter of blood (total white blood cell [WBC] count in red; engineered [marked] cells in green). Right y-axis shows the number of copies of DNA used in the engineered T cells as a function of total genomic DNA in peripheral blood mononuclear cells (PBMCs) over time. (B). Distribution of engineered T cells in tissue samples obtained post mortem in both patients. qPCR for vector sequences was performed from total genomic DNA obtained from flash-frozen tissues. Note different scale on y-axis for Case 1 and Case 2.
Figure 4
Figure 4
Analysis of cardiac-specific toxicity. (A) Pathologic and immunohistochemical analysis of myocardium from both patients. Hematoxylin and eosin (H&E) stained sections of myocardium shown at two magnifications for each patient (top panels), demonstrating lymphocytic infiltrate and diffuse myocyte necrosis. Immunohistochemical (IHC) staining with anti-CD3 (lower panels) demonstrates that lymphocytic infiltrates are T cells, shown at two magnifications. (B) Cytokines in the peripheral blood and the pericardial fluid in Case 2 obtained post mortem show evidence of T-cell activation. Thirty cytokines were assayed; each cytokine level shown is normalized to the concentration of that cytokine in a peripheral blood sample obtained at baseline. The patient was given injections of filgrastim (G-CSF) as per standard of care post-ASCT. Baseline levels of cytokines in blood were VEGF, 1.73 pg/mL; IL-1β, 0.5 pg/mL; G-CSF, 10.51 pg/mL; epidermal growth factor (EGF), 23.13 pg/mL; IL-10, 2.54 pg/mL; HGF, 357.83 pg/mL; FGF-basic, 4.45 pg/mL; IFN-α, 70.76 pg/mL; IL-6, 3.42 pg/mL; IL-12, 93.34 pg/mL; regulated upon activation, normal T-cell expressed and secreted (RANTES), 12 717 pg/mL; eotaxin, 76.1 pg/mL; IL-13, 0.53 pg/mL; IL-15, 59.94 pg/mL; IL-17, 0.16 pg/mL; macrophage inflammatory protein 1 alpha (MIP-1α/CCL3), 14.85 pg/mL; GM-CSF, 0.77 pg/mL; MIP-1β, 36.44 pg/mL; MCP-1, 953 pg/mL; IL-5, 0.34 pg/mL; IFN-γ, 2.49 pg/mL; tumor necrosis factor alpha (TNF-α), 1.26 pg/mL; IL-1Rα, 37.66 pg/mL; IL-2, 0.56 pg/mL; IL-7, 15.36 pg/mL; IP-10, 23.14 pg/mL; IL-2R, 205.81 pg/mL; MIg, 10.51 pg/mL; IL-4, 9.91 pg/mL; and IL-8, 10.68 pg/mL.
Figure 5
Figure 5
Elucidation of mechanism of clinical cardiac toxicity. (A) Analysis for expression of the correctly paired MAGE-A3–engineered TCR (MAGE dextramer staining, y-axis) of input (untransduced) T cells, transduced T-cell product, and T cells recovered from PBMCs in both patients at time of death. The x-axis shows staining for specific TCR-β chain (Vβ5.1) used by the engineered MAGE-A3 TCRs. Numbers shown in each quadrant indicate percentages of the gated CD3+ cells. Cell populations that stain only for Vβ5.1 but not dextramer are the sum of (1) endogenous TCR that uses that β chain (ie, population shown in input T cells) and (2) mispaired MAGE-A3–engineered TCR. No expansion of T cells with mispaired TCRs was detected after infusion in the patients. (B) A sample of the T-cell product infused into Case 2, along with fresh MAGE-A3a3a–transduced T cells and untransduced T cells, was tested for IFN-γ production by ELISPOT when cocultured with a large panel of HLA-A1+ cell lines, including one that was MAGE-A3+ (EJM) as a positive control. Bars indicate mean ± standard error of the mean (SEM) of 3 replicates. (C) Activation and cytokine production of MAGE-engineered T cells incubated in vitro with HLA-A*01+, titin-positive, MAGE-A3 beating cardiac myocyte cells derived from iPSC-CM or iCells. The EJM plasmacytoma cell line expresses HLA-A*01 and MAGE-A3 (positive control), and the colo205 cancer cell line expresses HLA-A*01 but not MAGE-A3 or titin (negative control). Controls for the effector cells are nontransduced (ntd) T cells, or no T cells (targets only). Bars indicate mean ± SEM of 3 replicates. *P < .0001 by Student t test.

Comment in

References

    1. Schumacher TN. T-cell-receptor gene therapy. Nat Rev Immunol. 2002;2(7):512–519. - PubMed
    1. Varela-Rohena A, Molloy PE, Dunn SM, et al. Control of HIV-1 immune escape by CD8 T cells expressing enhanced T-cell receptor. Nat Med. 2008;14(12):1390–1395. [Epub 2008 Nov 1399] - PMC - PubMed
    1. Robbins PF, Morgan RA, Feldman SA, et al. Tumor regression in patients with metastatic synovial cell sarcoma and melanoma using genetically engineered lymphocytes reactive with NY-ESO-1. J Clin Oncol. 2011;29(7):917–924. - PMC - PubMed
    1. Purbhoo MA, Sutton DH, Brewer JE, et al. Quantifying and imaging NY-ESO-1/LAGE-1-derived epitopes on tumor cells using high affinity T cell receptors. J Immunol. 2006;176(12):7308–7316. - PubMed
    1. Cameron BJ, Gerry AB, Dukes J, et al. Identification of titin as an alternative specificity for engineered T cells expressing an enhanced affinity MAGE A3 TCR. Sci Transl Med. In press.

MeSH terms