Review
. 2013 Jul;6(4):998-1017.
doi: 10.1093/mp/sst103. Epub 2013 Jun 14.

Control of cell wall extensibility during pollen tube growth

Affiliations
Review

Control of cell wall extensibility during pollen tube growth

Peter K Hepler et al. Mol Plant. 2013 Jul.

Abstract

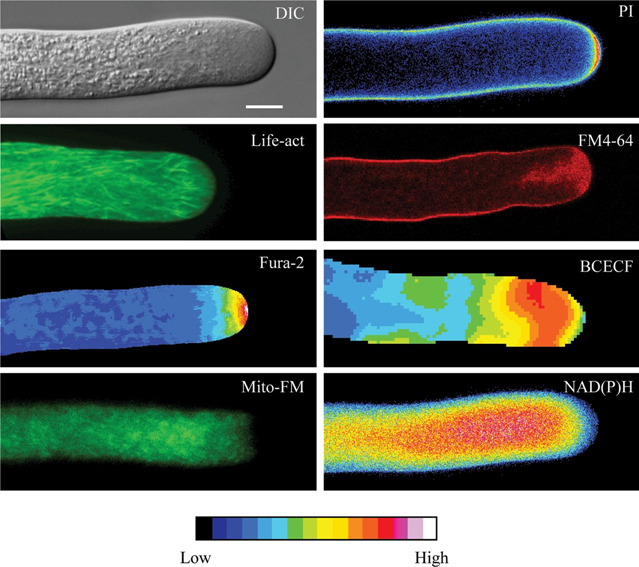
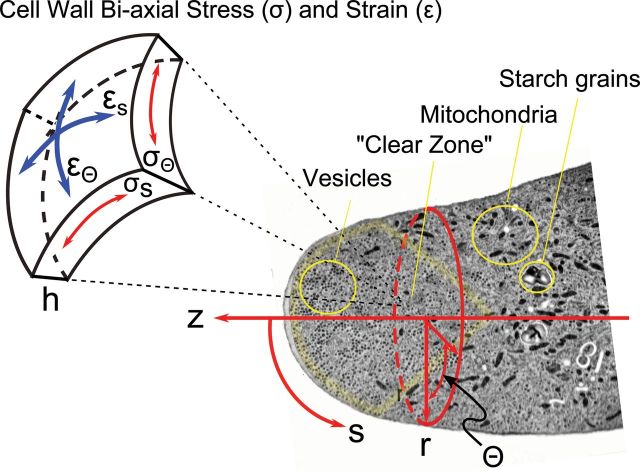
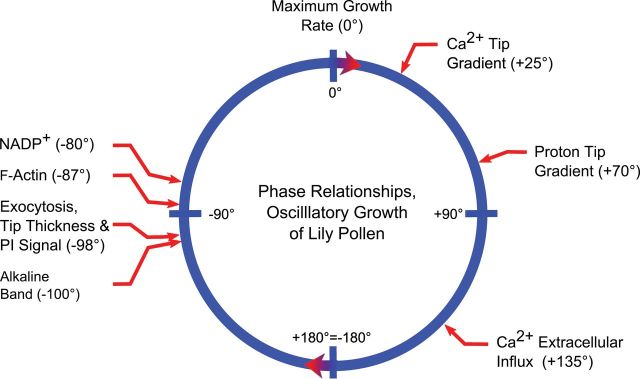
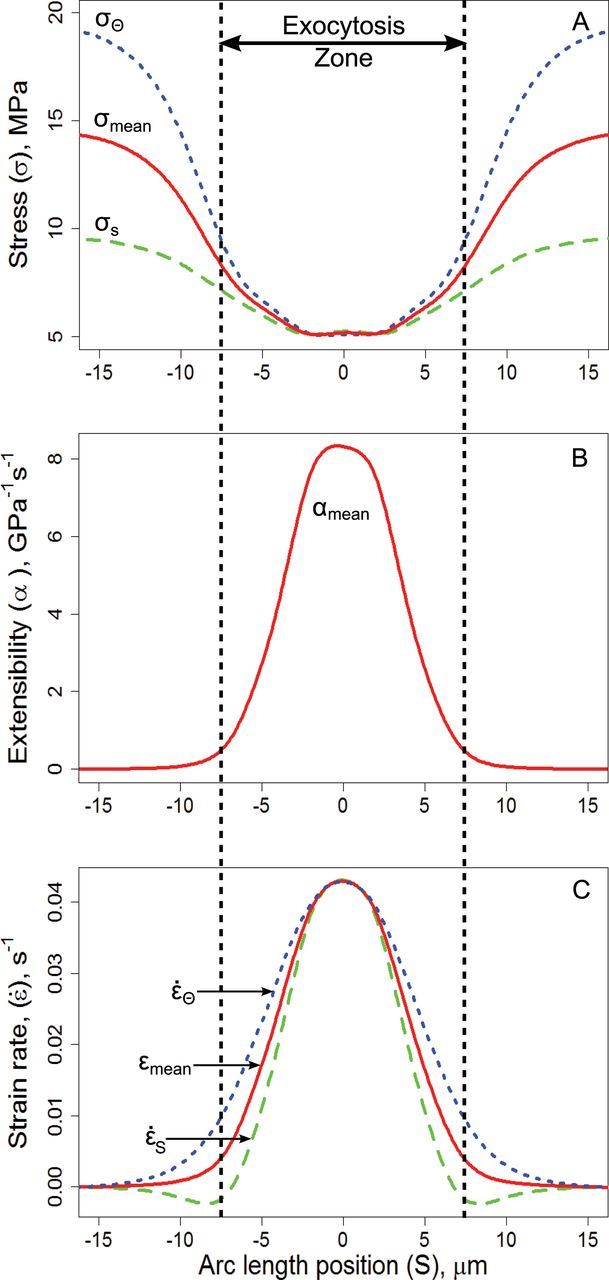
In this review, we address the question of how the tip-growing pollen tube achieves its rapid rate of elongation while maintaining an intact cell wall. Although turgor is essential for growth to occur, the local expansion rate is controlled by local changes in the viscosity of the apical wall. We focus on several different structures and underlying processes that are thought to be major participants including exocytosis, the organization and activity of the actin cytoskeleton, calcium and proton physiology, and cellular energetics. We think that the actin cytoskeleton, in particular the apical cortical actin fringe, directs the flow of vesicles to the apical domain, where they fuse with the plasma membrane and contribute their contents to the expanding cell wall. While pH gradients, as generated by a proton-ATPase located on the plasma membrane along the side of the clear zone, may regulate rapid actin turnover and new polymerization in the fringe, the tip-focused calcium gradient biases secretion towards the polar axis. The recent data showing that exocytosis of new wall material precedes and predicts the process of cell elongation provide support for the idea that the intussusception of newly secreted pectin contributes to decreases in apical wall viscosity and to cell expansion. Other prime factors will be the localization and activity of the enzyme pectin methyl-esterase, and the chelation of calcium by pectic acids. Finally, we acknowledge a role for reactive oxygen species in the control of wall viscosity.

Keywords: cell expansion; cell walls; cytoskeleton dynamics; polarity; pollen development..


Figures

Figure 1.
Figure 1.
Images of Living Lily Pollen Tubes Showing Different Structures or Activities. DIC: When examined with Nomarski differential interference contrast optics, the internal structure of the tube is depicted clearly. A clear zone in the apex stands apart from the shank, which contains numerous refractive amyloplasts. The marker is 10 μm and applies to all the images. PI: A tube stained with propidium iodide (PI) displays greater staining in the cell wall at the extreme apex indicating a thickened cell wall. Life-act: The pollen tube has been transiently transformed with Lifeact–GFP, which stains F-actin. Note the apical fringe. FM4-64: This dye vitally stains the plasma membrane and the inverted cone of vesicles. Fura-2: This cell has been injected with Fura-2-dextran, which allows us to image the free Ca2+ throughout the cell. Note the steep tip-focused gradient of Ca2+ at the extreme apex. Typically, the [Ca2+] is above 1 μM (colors of red to white on the LUT), while, 20 μm back from the tip, the concentration is 100–200nM (color blue on the LUT). BCECF: This cell has been injected with BCECF-dextran, a pH-sensitive dye. The image shows the prominent alkaline band in the clear zone, in which the pH reaches 7.5 (color orange to red on the LUT). The tip is slightly acidic at approximately pH 6.8 (color green to blue on the LUT). Mito-FM: The fluorescent dye Mitotracker-FM stains mitochondria, and shows that these organelles accumulate towards the base of the clear zone. NAD(P)H: The endogenous reduced co-factor, NAD(P)H possess fluorescence and thus can be imaged directly. The strongest signal localizes to the region of accumulated mitochondria, seen to the left. This figure is from Rounds et al. (2011b).
Figure 2.
Figure 2.
Coordinate Systems for Pollen Tube Growth Models. An electron micrograph (Lancelle and Hepler, 1992), labeled to show the location of mitochondria, starch grains, secretory vesicles, and the ‘clear zone’ is overlain with a cylindrical coordinate system in which elongation is measured along the z-axis while the variable r(z) specifies the location of the cell wall along z and thus cell shape. Since the cell is assumed to be axisymmetric around z, cell shape is also fully described by Кs(S), curvature along the meridian (μm–1). Cell wall properties and dynamics are specified in a unit cell in which tensile stress in the wall (σ, MPa) is followed along two orthogonal directions, circumferential (σθ), and meridional (σs), and the corresponding rates of strain (s–1) are termed έr and έs. Wall thickness (h, μm) is a balance between loss of material by viscous flow and secretion of new wall material by vesicle fusion with the cell membrane. The respective values of the two components of biaxial stress at any point on the surface of the cell depend upon internal hydrostatic pressure, wall thickness, local wall curvature, and the degree of flow coupling (Dumais et al., 2004).
Figure 3.
Figure 3.
Phase Relationships in Oscillatory Growth. This diagram shows the phase relationship between several different processes and oscillatory pollen tube growth. The positive sign (+) indicates that the increase in the particular event follows the increase in growth rate, whereas the negative sign (–) indicates that the increase in the event precedes the increase in growth rate. It has come as a surprise that the increase in the intracellular Ca2+ follows in the increase in growth rate. In addition, the increase in intracellular Ca2+ is out of phase with the increase in extracellular Ca2+ influx, and even more out of phase with the process of exocytosis. A series of events including the increase in NAD(P)+, F-actin, exocytosis, build-up of wall material at the tip, and alkalinity all precede and thus anticipate the increase in growth rate. These events deserve further attention as potential stimulators of the growth rate.
Figure 4.
Figure 4.
Pollen Tube Rheology Derived from Empirical Measurements of Cell Shape and Surface Expansion Rates (Redrawn from Rojas et al. (2011) with Calculations of Extensibility as Derived by Bernal et al. (2007) and Dumais et al. (2004)). (A) illustrates tensile stress along the meridian (σs) and the circumference (σθ) and the average stress (σmean = (σs + σθ)/2) from the tip (S = 0 μm) to the shank (S = 15 μm). Stress is minimum at the tip (~5 MPa), the point of maximum curvature in this cell (Кs = Кθ = 0.2 μm–1, Figure 4B in Rojas et al. (2011)), equal in all directions, and is calculated as σs = P/(2·h·Кs) constant turgor (0.2 MPa) impinging on a thin shell of constant thickness (0.1 μm) of smoothly changing curvature (note that the axis values on this plot differ from Rojas et al. (2011) and are recalculated from data in the same paper). Meridional and circumferential stress both increase rapidly towards the shank, at which point Кs disappears and Кθ becomes 1/r (cell radius, r = 5 μm) so that σθ becomes 2·P·r/h ~ 20 MPa (hoop stress of a cylinder) while σs = P·r/h ~ 10 MPa (axial stress of a cylinder). (C) plots the local strain rate along S (έs, s–1) and θ (έθ, s–1) as measured (Rojas et al., 2011) by following the trajectory of fluorescent beads. Mean strain rate (έmean, s–1) is calculated as (έs + έθ)/2. For (B), mean stress and strain were used to estimate the extensibility (αmean = έmeanmean, GPa–1 s–1) of the wall material along the meridian. In the absence of a more complex set of constitutive equations and information about values for flow coupling and possible material anisotropy (crucial factors in determining cell shape (Dumais et al., 2006)) and wall thickness, we choose extensibility to illustrate the spatial pattern of wall rheology required to give rise to the observed patterns of shape and growth rates rather than attempt to calculate viscosity.

References

    1. Allwood E.G., Anthony R.G., Smertenko A.P., Reichelt S., Drøbak B.K., Doonan J.H., Weeds A.G., Hussey P.J. (2002). Regulation of the pollen-specific actin-depolymerizing factor LIADF1. Plant Cell. 14, 2915–2927 - PMC - PubMed
    1. Anderson J.R., Barnes W.S., Bedinger P. (2002). 2,6-dichlorobenzonitrile, a cellulose biosynthesis inhibitor, affects morphology and structural integrity of petunia and lily pollen tubes. J. Plant Physiol. 159, 61–67
    1. Aouar L., Chebli Y., Geitmann A. (2010). Morphogenesis of complex plant cell shapes: the mechanical role of crystalline cellulose in growing pollen tubes. Sex. Plant Reprod. 23, 15–27 - PubMed
    1. Baluška F., Hlavacka A., Šamaj J., Palme K., Robinson D.G., Matoh T., McCurdy D.W., Menzel D., Volkmann D. (2002). F-actin-dependent endocytosis of cell wall pectins in meristematic root cells: insights from brefeldin A-induced compartments. Plant Physiol. 130, 422–431 - PMC - PubMed
    1. Baron-Epel O., Gharyal P.K., Schindler M. (1988). Pectins as mediators of wall porosity in soybean cells. Planta. 175, 389–395 - PubMed

Publication types

MeSH terms

LinkOut - more resources