

A high-throughput splicing assay identifies new classes of inhibitors of human and yeast spliceosomes
- PMID: 23771823
- PMCID: PMC3902173
- DOI: 10.1177/1087057113493117
A high-throughput splicing assay identifies new classes of inhibitors of human and yeast spliceosomes
Abstract
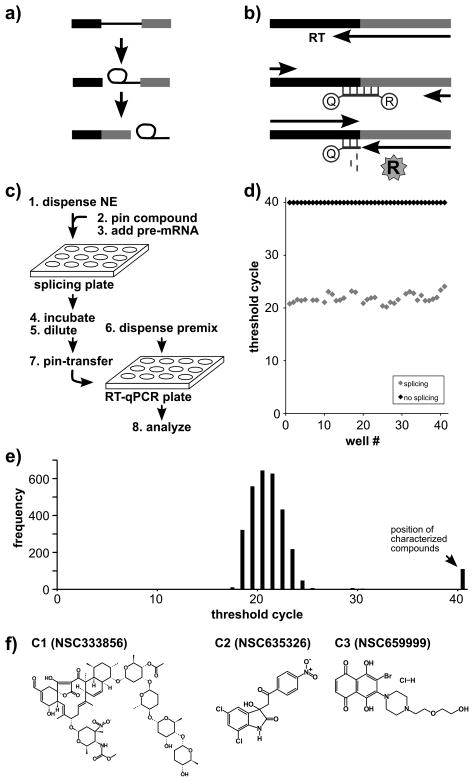
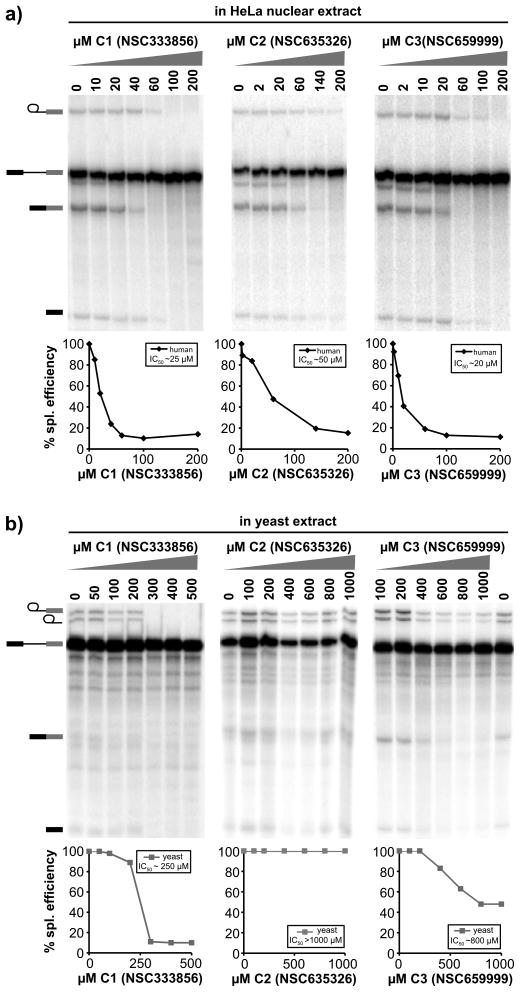
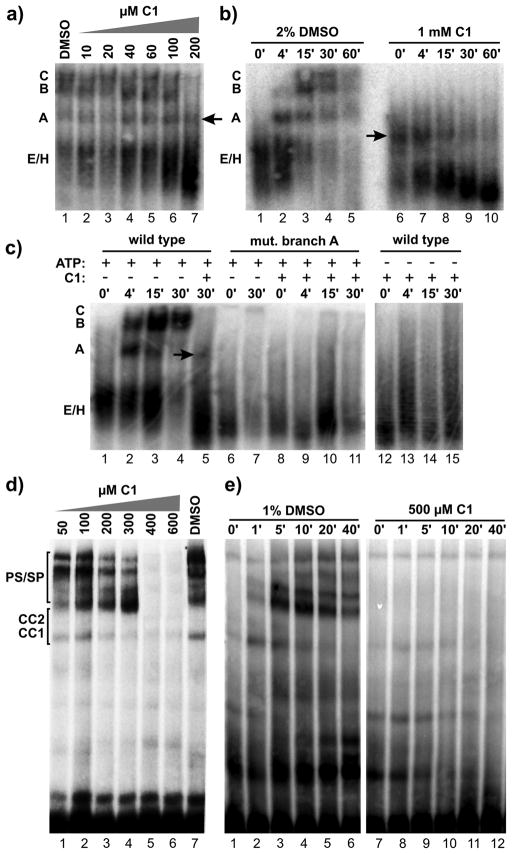
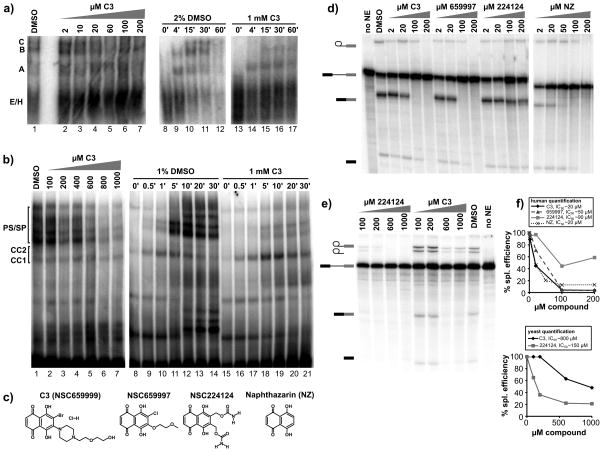
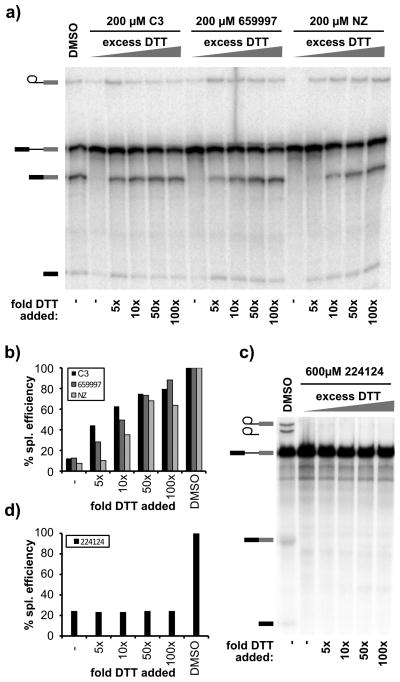
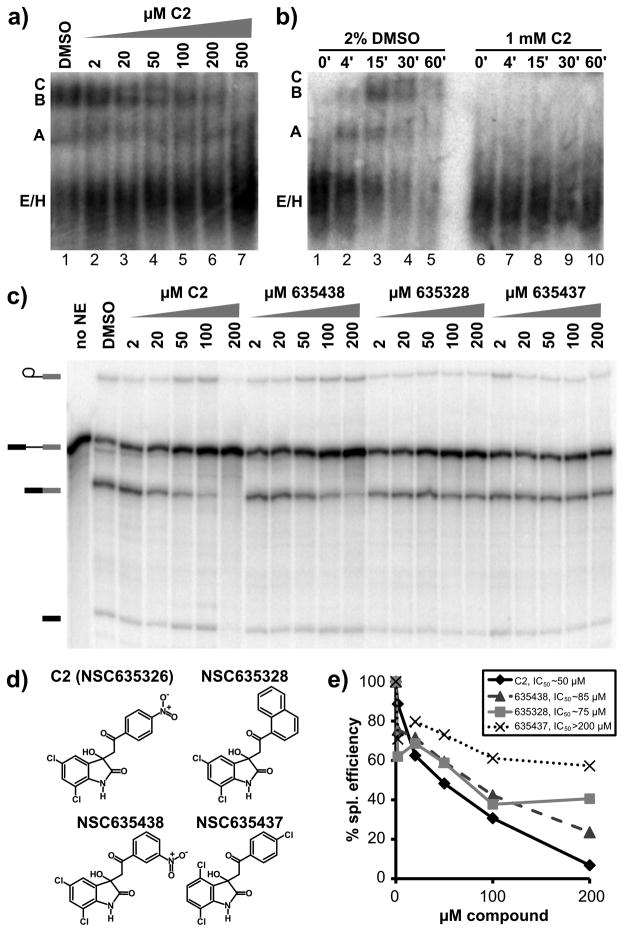
The spliceosome is the macromolecular machine responsible for pre-mRNA splicing, an essential step in eukaryotic gene expression. During splicing, myriad subunits join and leave the spliceosome as it works on the pre-mRNA substrate. Strikingly, there are very few small molecules known to interact with the spliceosome. Splicing inhibitors are needed to capture transient spliceosome conformations and probe important functional components. Such compounds may also have chemotherapeutic applications, as links between splicing and cancer are increasingly uncovered. To identify new splicing inhibitors, we developed a high-throughput assay for in vitro splicing using a reverse transcription followed by quantitative PCR readout. In a pilot screen of 3080 compounds, we identified three small molecules that inhibit splicing in HeLa extract by interfering with different stages of human spliceosome assembly. Two of the compounds similarly affect spliceosomes in yeast extracts, suggesting selective targeting of conserved components. By examining related molecules, we identified chemical features required for the activity of two of the splicing inhibitors. In addition to verifying our assay procedure and paving the way to larger screens, these studies establish new compounds as chemical probes for investigating the splicing machinery.
Keywords: RT-qPCR; high-throughput assay; inhibitor; pre-mRNA splicing; spliceosome.
Figures
Similar articles
-
Modulating splicing with small molecular inhibitors of the spliceosome.Wiley Interdiscip Rev RNA. 2017 Mar;8(2):10.1002/wrna.1381. doi: 10.1002/wrna.1381. Epub 2016 Jul 21. Wiley Interdiscip Rev RNA. 2017. PMID: 27440103 Free PMC article. Review.
-
Small molecule inhibitors of yeast pre-mRNA splicing.ACS Chem Biol. 2009 Sep 18;4(9):759-68. doi: 10.1021/cb900090z. ACS Chem Biol. 2009. PMID: 19634919
-
The Natural Product N-Palmitoyl-l-leucine Selectively Inhibits Late Assembly of Human Spliceosomes.J Biol Chem. 2015 Nov 13;290(46):27524-31. doi: 10.1074/jbc.M115.673210. Epub 2015 Sep 25. J Biol Chem. 2015. PMID: 26408199 Free PMC article.
-
A quantitative high-throughput in vitro splicing assay identifies inhibitors of spliceosome catalysis.Mol Cell Biol. 2012 Apr;32(7):1271-83. doi: 10.1128/MCB.05788-11. Epub 2012 Jan 17. Mol Cell Biol. 2012. PMID: 22252314 Free PMC article.
-
The function of the NineTeen Complex (NTC) in regulating spliceosome conformations and fidelity during pre-mRNA splicing.Biochem Soc Trans. 2010 Aug;38(4):1110-5. doi: 10.1042/BST0381110. Biochem Soc Trans. 2010. PMID: 20659013 Free PMC article. Review.
Cited by
-
Mechanisms and Regulation of Alternative Pre-mRNA Splicing.Annu Rev Biochem. 2015;84:291-323. doi: 10.1146/annurev-biochem-060614-034316. Epub 2015 Mar 12. Annu Rev Biochem. 2015. PMID: 25784052 Free PMC article. Review.
-
Modulating splicing with small molecular inhibitors of the spliceosome.Wiley Interdiscip Rev RNA. 2017 Mar;8(2):10.1002/wrna.1381. doi: 10.1002/wrna.1381. Epub 2016 Jul 21. Wiley Interdiscip Rev RNA. 2017. PMID: 27440103 Free PMC article. Review.
-
Biology of the mRNA Splicing Machinery and Its Dysregulation in Cancer Providing Therapeutic Opportunities.Int J Mol Sci. 2021 May 12;22(10):5110. doi: 10.3390/ijms22105110. Int J Mol Sci. 2021. PMID: 34065983 Free PMC article. Review.
-
Identification of a small molecule inhibitor that stalls splicing at an early step of spliceosome activation.Elife. 2017 Mar 16;6:e23533. doi: 10.7554/eLife.23533. Elife. 2017. PMID: 28300534 Free PMC article.
-
Identification of phenothiazine derivatives as UHM-binding inhibitors of early spliceosome assembly.Nat Commun. 2020 Nov 6;11(1):5621. doi: 10.1038/s41467-020-19514-1. Nat Commun. 2020. PMID: 33159082 Free PMC article.
References
-
- Wahl MC, Will CL, Luhrmann R. The spliceosome: design principles of a dynamic RNP machine. Cell. 2009;136(4):701–18. - PubMed
-
- Konarska MM, Sharp PA. Electrophoretic separation of complexes involved in the splicing of precursors to mRNAs. Cell. 1986;46(6):845–55. - PubMed
-
- Landau DA, Carter SL, Stojanov P, McKenna A, Stevenson K, Lawrence MS, Sougnez C, Stewart C, Sivachenko A, Wang L, Wan Y, Zhang W, Shukla SA, Vartanov A, Fernandes SM, Saksena G, Cibulskis K, Tesar B, Gabriel S, Hacohen N, Meyerson M, Lander ES, Neuberg D, Brown JR, Getz G, Wu CJ. Evolution and impact of subclonal mutations in chronic lymphocytic leukemia. Cell. 2013;152(4):714–26. - PMC - PubMed
-
- Papaemmanuil E, Cazzola M, Boultwood J, Malcovati L, Vyas P, Bowen D, Pellagatti A, Wainscoat JS, Hellstrom-Lindberg E, Gambacorti-Passerini C, Godfrey AL, Rapado I, Cvejic A, Rance R, McGee C, Ellis P, Mudie LJ, Stephens PJ, McLaren S, Massie CE, Tarpey PS, Varela I, Nik-Zainal S, Davies HR, Shlien A, Jones D, Raine K, Hinton J, Butler AP, Teague JW, Baxter EJ, Score J, Galli A, Della Porta MG, Travaglino E, Groves M, Tauro S, Munshi NC, Anderson KC, El-Naggar A, Fischer A, Mustonen V, Warren AJ, Cross NC, Green AR, Futreal PA, Stratton MR, Campbell PJ. Somatic SF3B1 mutation in myelodysplasia with ring sideroblasts. N Engl J Med. 2011;365(15):1384–95. - PMC - PubMed
-
- Quesada V, Conde L, Villamor N, Ordonez GR, Jares P, Bassaganyas L, Ramsay AJ, Bea S, Pinyol M, Martinez-Trillos A, Lopez-Guerra M, Colomer D, Navarro A, Baumann T, Aymerich M, Rozman M, Delgado J, Gine E, Hernandez JM, Gonzalez-Diaz M, Puente DA, Velasco G, Freije JM, Tubio JM, Royo R, Gelpi JL, Orozco M, Pisano DG, Zamora J, Vazquez M, Valencia A, Himmelbauer H, Bayes M, Heath S, Gut M, Gut I, Estivill X, Lopez-Guillermo A, Puente XS, Campo E, Lopez-Otin C. Exome sequencing identifies recurrent mutations of the splicing factor SF3B1 gene in chronic lymphocytic leukemia. Nat Genet. 2011;44(1):47–52. - PubMed
Publication types
MeSH terms
Substances
Grants and funding
LinkOut - more resources
Full Text Sources
Other Literature Sources
Molecular Biology Databases
