. 2013 Jun;25(6):2070-83.
doi: 10.1105/tpc.113.113035. Epub 2013 Jun 14.

A role for APETALA1/fruitfull transcription factors in tomato leaf development

Affiliations

A role for APETALA1/fruitfull transcription factors in tomato leaf development

Yogev Burko et al. Plant Cell. 2013 Jun.

Abstract

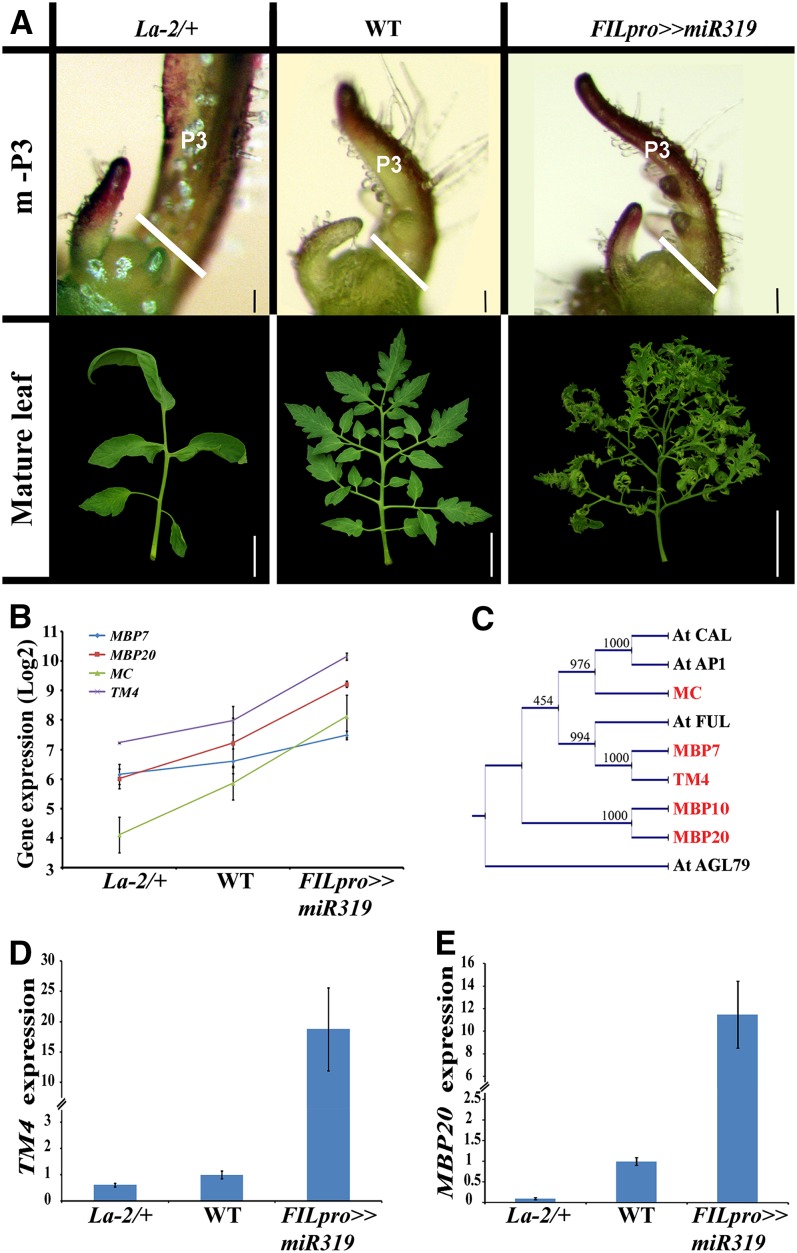
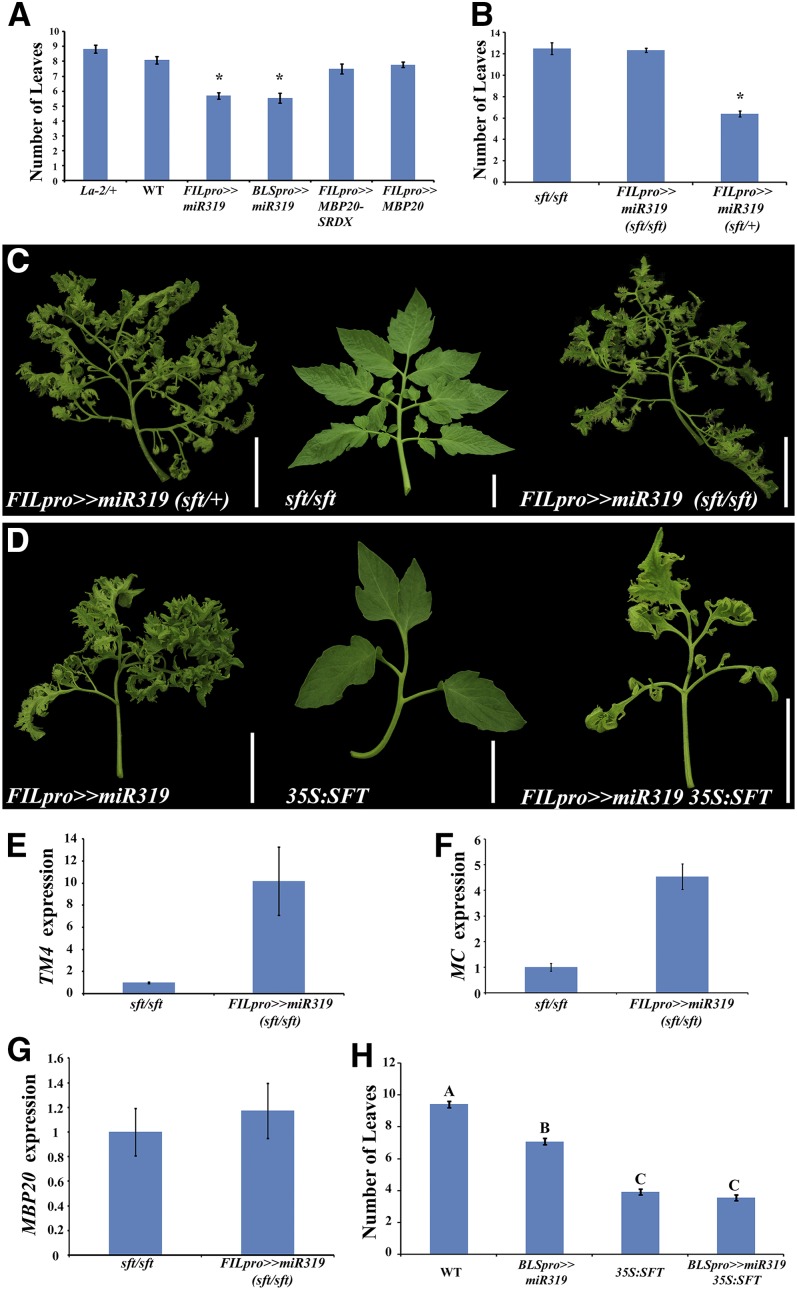
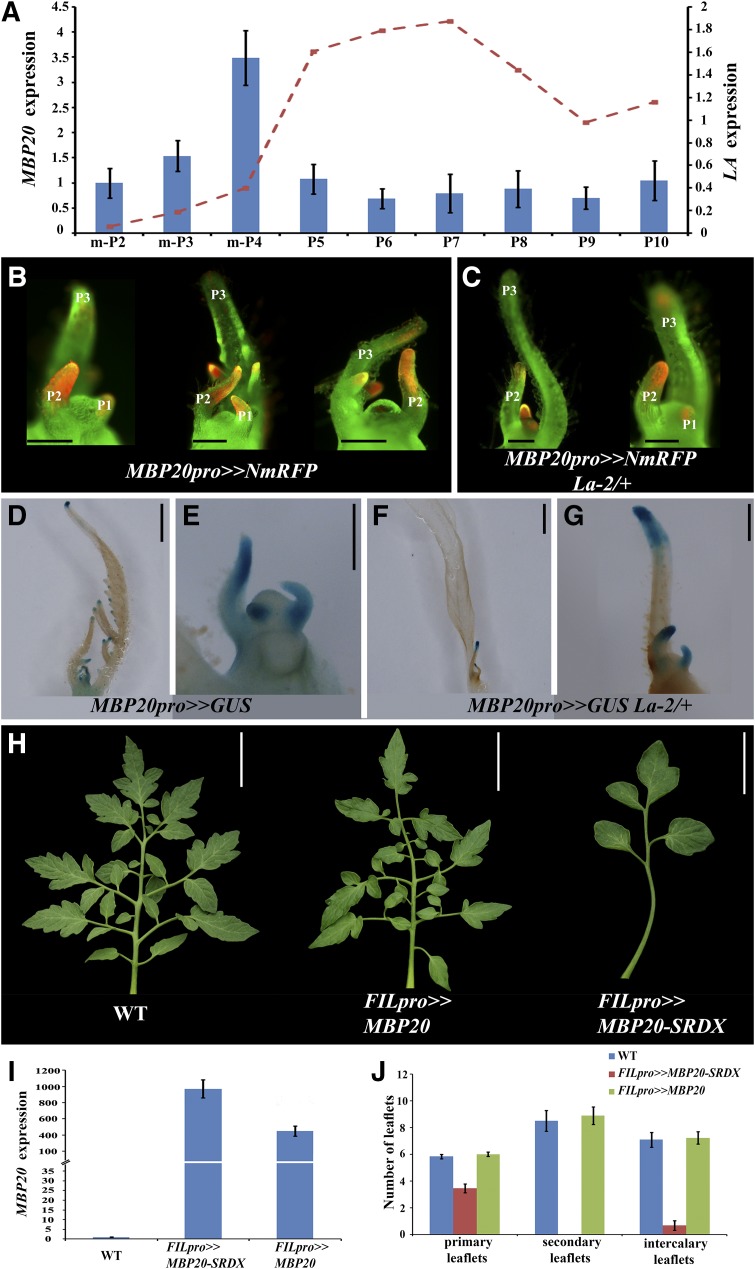
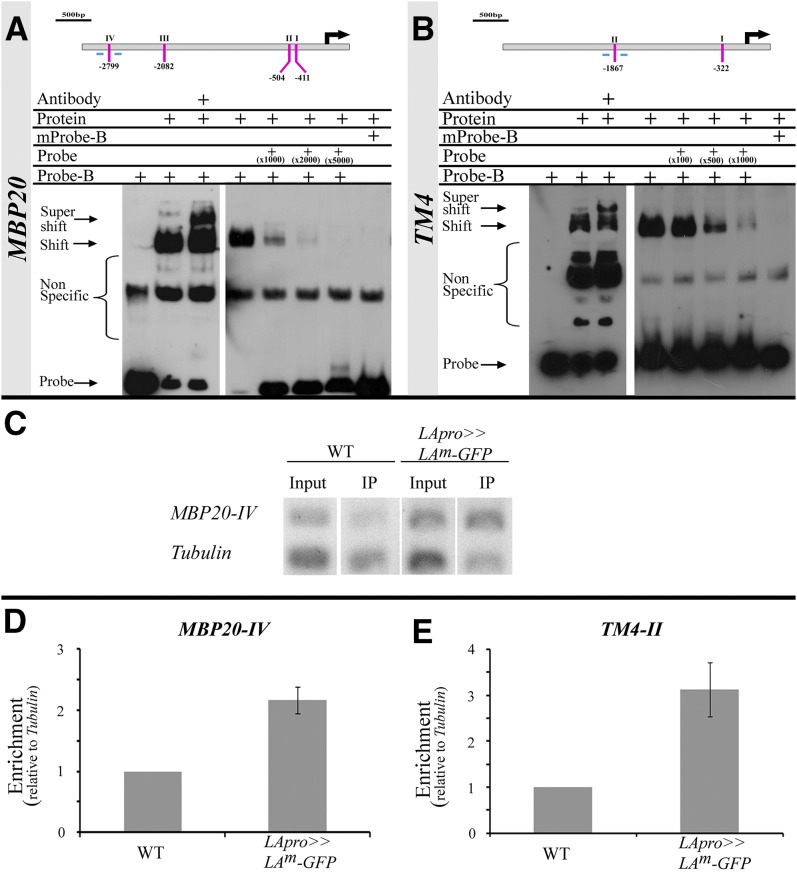
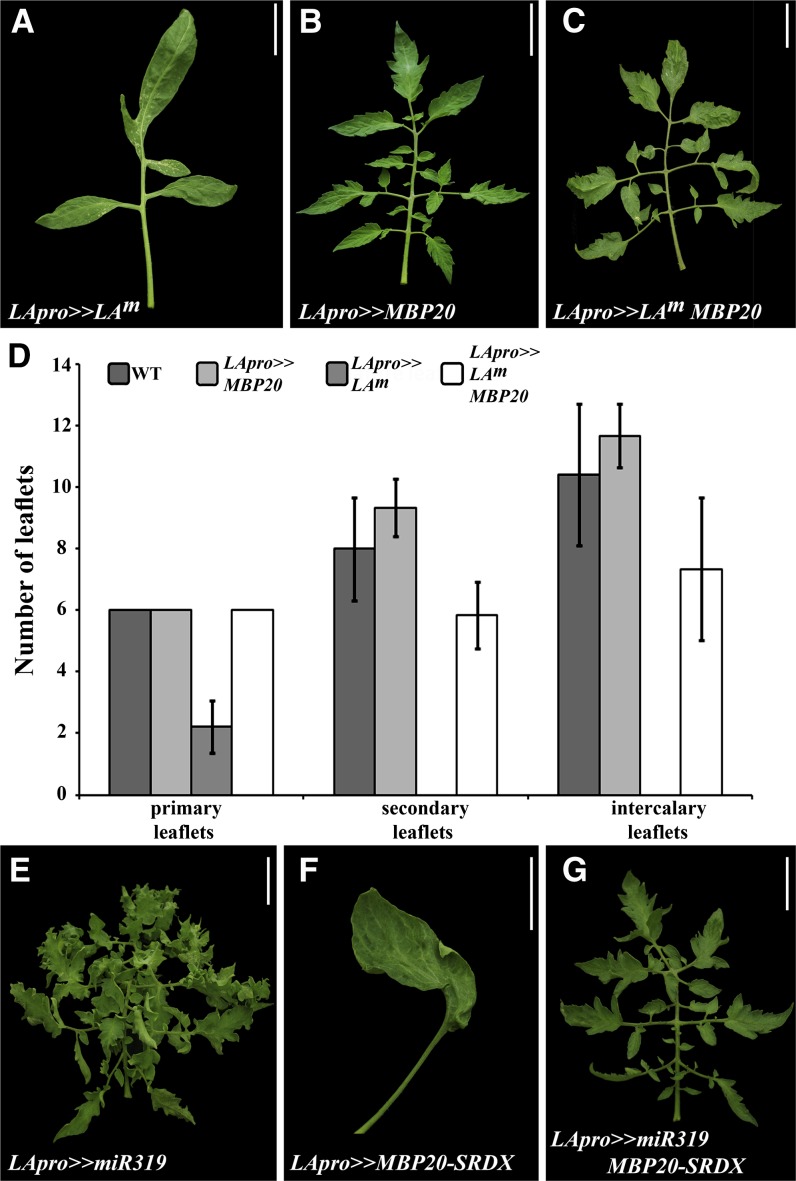
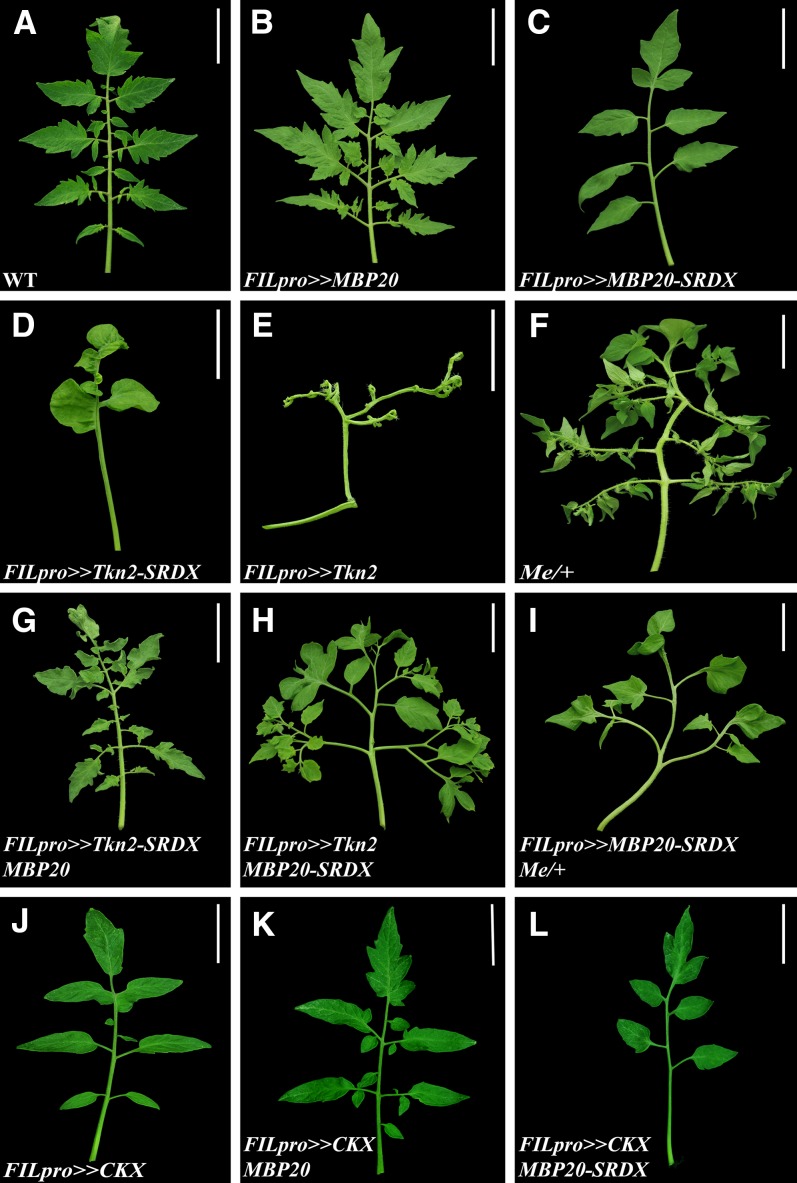
Flexible maturation rates underlie part of the diversity of leaf shape, and tomato (Solanum lycopersicum) leaves are compound due to prolonged organogenic activity of the leaf margin. The CINCINNATA-teosinte branched1, cycloidea, PCF (CIN-TCP) transcription factor lanceolate (LA) restricts this organogenic activity and promotes maturation. Here, we show that tomato APETALA1/fruitfull (AP1/FUL) MADS box genes are involved in tomato leaf development and are repressed by LA. AP1/FUL expression is correlated negatively with LA activity and positively with the organogenic activity of the leaf margin. LA binds to the promoters of the AP1/FUL genes MBP20 and TM4. Overexpression of MBP20 suppressed the simple-leaf phenotype resulting from upregulation of LA activity or from downregulation of class I knotted like homeobox (KNOXI) activity. Overexpression of a dominant-negative form of MBP20 led to leaf simplification and partly suppressed the increased leaf complexity of plants with reduced LA activity or increased KNOXI activity. Tomato plants overexpressing miR319, a negative regulator of several CIN-TCP genes including LA, flower with fewer leaves via an SFT-dependent pathway, suggesting that miR319-sensitive CIN-TCPs delay flowering in tomato. These results identify a role for AP1/FUL genes in vegetative development and show that leaf and plant maturation are regulated via partially independent mechanisms.


Figures

Figure 1.
Figure 1.
Expression of AP1/FUL Genes Is Positively Correlated with the Organogenic Activity of the Leaf Margin. (A) Phenotypes of young leaf primordia and mature leaves of the genotypes used for the expression profiling. m-P3, SAM and three youngest leaf primordia. Genotypes are indicated at the top of each column. For microarray analysis, tissue was collected from the SAM and two youngest leaf primordia, as indicated by the white line in the top row. Bars = 0.1 mm (top row) and 5 cm (bottom row). WT, the wild type. (B) Microarray expression data for four AP1/FUL genes, shown as an average of three biological repeats (±se). (C) Phylogenetic analysis of tomato and Arabidopsis AP1/FUL genes. (D) and (E) Expression of TM4 (D) and MBP20 (E) in the fifth leaf at the P5 stage of the indicated genotypes. Expression was assayed by qRT-PCR relative to the reference gene EXP and is shown as an average of three biological repeats (±se). FILpro>>miR319 plants expresses miR319 under the control of the FIL promoter. [See online article for color version of this figure.]
Figure 2.
Figure 2.
miR319 Affects Plant and Leaf Maturation via Separate Pathways. (A) and (B) Number of leaves until the first visible flower. Shown are averages ± se (for FILpro>>MBP20-SRDX, n = 5; for all other genotypes, n = 10). Asterisks indicate statistically significant differences from the wild type (A) or sft (B) at P < 0.05. (C) and (D) Mature leaves of the indicated genotypes. 35S:SFT plants express SFT under the control of the 35S promoter by direct fusion; FILpro>>miR319 plants express miR319 under the control of the FIL promoter using the transactivation system (Moore et al., 1998). Bars = 5 cm. (E) to (G) Expression of TM4 (E), MC (F), and MBP20 (G) in apices containing the SAM and six youngest leaf primordia, in which the third leaf of the plant was at the P6 stage. Relative expression was assayed using qRT-PCR relative to the reference gene EXP and is shown as an average of four biological repeats ±se. (H) Number of leaves until the first visible flower. Shown are averages ±se (n > 7). Letters indicate statistically significant differences at P < 0.05. [See online article for color version of this figure.]
Figure 3.
Figure 3.
Expression and Function of MBP20 in Tomato Leaf Development. (A) Expression dynamics of MBP20 (columns, left axis) and LA (red dashed line, right axis) along the development of the fifth leaf of wild-type tomato plants, assayed by qRT-PCR relative to the reference gene EXP. Shown are averages ± se (n = three to six biological repeats). m-P2, m-P3, and m-P4 represent SAM and two, three, or four youngest leaf primordia, respectively. The LA expression data is illustrated according to Shleizer-Burko et al. (2011). (B) and (C) Fluorescence of the mRFP protein expressed under the control of the MBP20 promoter (red) at stages P1 to P3 in the wild type (B) and La-2/+ (C) viewed with a stereomicroscope using a Nuance camera and software (CRi). (D) to (G) Histochemical staining of β-glucuronidase (GUS) activity (blue). β-Glucuronidase was expressed under the control of the MBP20 promoter. Shown are SAM and five youngest leaf primordia ([D] and [F]) and magnifications of the SAM and three youngest primordia ([E] and [G]) of the wild type ([D] and [E]) and La-2/+ ([F] and [G]). (H) Fifth leaves of the indicated genotypes. WT, the wild type. (I) MBP20-SRDX and MBP20 expression in apices containing the SAM and five youngest leaf primordia of FILpro>>MBP20 and FILpro>>MBP20-SRDX transgenic plants compared with the wild type. Expression was assayed by qRT-PCR relative to the reference gene EXP and is shown as an average of four biological repeats (±se). (J) Number of primary, secondary, and intercalary leaflets on the fifth leaves of the indicated genotypes, shown as an average of seven to nine leaves from different plants (±se). Bars = 250 μm (B), (C), (E), and (G), 1 mm (D) and (F), and 5 cm in (H).
Figure 4.
Figure 4.
LA Binds to the MBP20 and TM4 Promoters. (A) and (B) Top: Schematic diagrams of the MBP20 (A) and TM4 (B) promoters and potential core TCP binding sites (GGNCC, indicated with lines and roman numerals). Black arrows indicate the translation start sites. Bottom: EMSA performed with biotin-labeled probes (Probe-B) and recombinant LA protein fused to MBP (Protein). The components included in each reaction are indicated above each lane. Probe, unlabeled probe (folds of the amount of labeled probe indicated); mProbe and mProbe-B, unlabeled and labeled mutated probe (…GGNaCt…), respectively; Antibody, antibodies against MBP. (C) to (E) PCR and quantitative PCR analyses of a ChIP assay, performed with wild-type plants (WT) or plants expressing a LAm-GFP fusion under the control of the LA promoter (LApro>>LAm-GFP) and anti-GFP antibodies. (C) PCRs were performed with specific primers for MBP20-IV (lines below the gene diagrams in [A]) and Tubulin. Input, nonimmunoprecipitated samples; IP, samples after ChIP. (D) and (E) Quantitative PCR reactions were performed with specific primers for MBP20-IV (D) or TM4-II (E) (lines below the gene diagrams in [A] and [B], respectively) or Tubulin. Shown are averages (±se) of fold enrichment, compared with the wild type (n = two technical and three biological repeats in [D] and three biological repeats in [E]). [See online article for color version of this figure.]
Figure 5.
Figure 5.
MBP20 Genetically Mediates LA Activity. (A) to (C) and (E) to (G) Mature leaves of the indicated genotypes. All the transgenes were expressed using the transactivation system. All leaves shown are from plants heterozygous for all transgenes, which include the promoter and the expressed gene. Bars = 5 cm. (D) Number of primary, secondary, and intercalary leaflets on mature leaves of the indicated genotypes, shown as an average of four to five leaves from different plants (±se). WT, the wild type. [See online article for color version of this figure.]
Figure 6.
Figure 6.
MBP20 and MBP20-SRDX Modify the Leaf Phenotypes Caused by Altered KNOXI and CK Activity. Mature leaves of the indicated genotypes. All transgenes were expressed using the transactivation system. WT, the wild type. Bars = 5 cm. [See online article for color version of this figure.]

References

    1. Aggarwal P., Das Gupta M., Joseph A.P., Chatterjee N., Srinivasan N., Nath U. (2010). Identification of specific DNA binding residues in the TCP family of transcription factors in Arabidopsis. Plant Cell 22: 1174–1189 - PMC - PubMed
    1. Archacki R., et al. (2013). BRAHMA ATPase of the SWI/SNF chromatin remodeling complex acts as a positive regulator of gibberellin-mediated responses in Arabidopsis. PLoS ONE 8: e58588. - PMC - PubMed
    1. Barth S., Geier T., Eimert K., Watillon B., Sangwan R.S., Gleissberg S. (2009). KNOX overexpression in transgenic Kohleria (Gesneriaceae) prolongs the activity of proximal leaf blastozones and drastically alters segment fate. Planta 230: 1081–1091 - PubMed
    1. Becker A., Theissen G. (2003). The major clades of MADS-box genes and their role in the development and evolution of flowering plants. Mol. Phylogenet. Evol. 29: 464–489 - PubMed
    1. Bemer M., Karlova R., Ballester A.R., Tikunov Y.M., Bovy A.G., Wolters-Arts M., Rossetto Pde.B., Angenent G.C., de Maagd R.A. (2012). The tomato FRUITFULL homologs TDR4/FUL1 and MBP7/FUL2 regulate ethylene-independent aspects of fruit ripening. Plant Cell 24: 4437–4451 - PMC - PubMed

Publication types

MeSH terms

LinkOut - more resources