

Fluorescent Polyelectrolyte Capped Silver Nanoclusters: Optimization and Spectroscopic Evaluation
- PMID: 23772092
- PMCID: PMC3678839
- DOI: 10.1016/j.cplett.2012.08.042
Fluorescent Polyelectrolyte Capped Silver Nanoclusters: Optimization and Spectroscopic Evaluation
Abstract
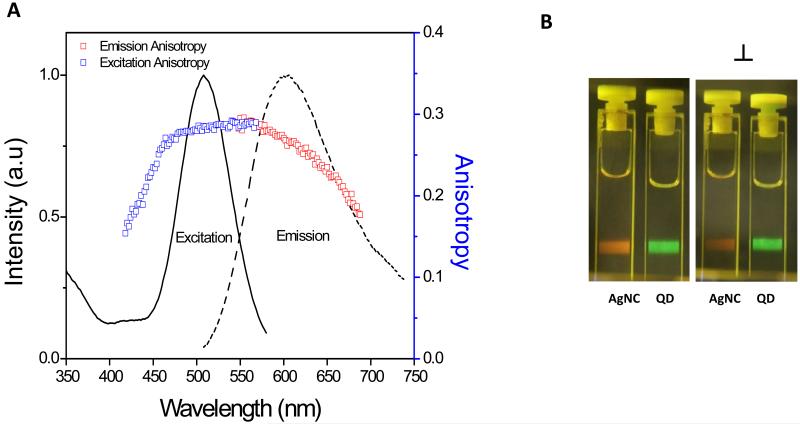
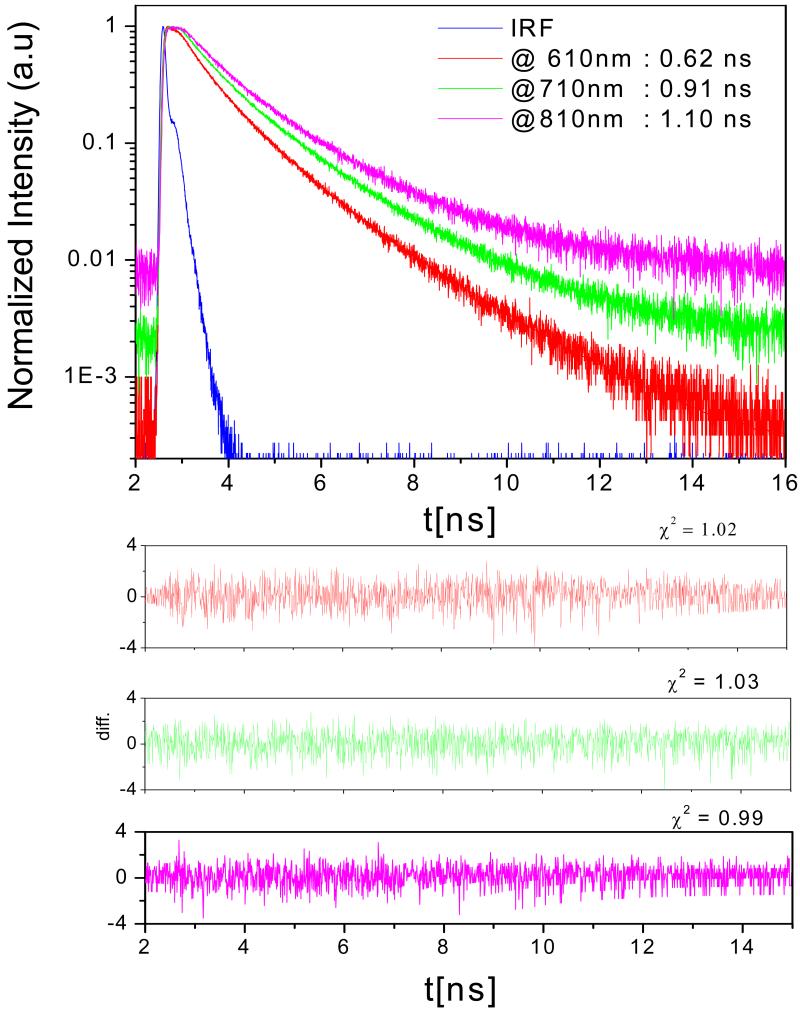
In the present work, we have synthesized water soluble Ag nanoclusters using PMAA as a template with different Ag+: COO-ratios, to optimize it for highest brightness using less UV exposure time. Fluorescence polarization was 0.30 for and was found to vary with excitation and emission wavelength with few hundred picoseconds average fluorescence lifetime. Fluorescence Correlation Spectroscopy data depicts slower diffusion at red excitation compared to blue excitation in confocal volume than conventionally synthesized colloids proving presence of multiple sizes. The optical properties of the particles are dependent upon the excitation wavelength used and the emission wavelength collected.
Keywords: FCS; Fluorescent Ag Nanoclusters; Metal Nanoclusters; Polarization; Polymethylacrylic Acid.
Figures


Similar articles
-
Silver nanoclusters emitting weak NIR fluorescence biomineralized by BSA.Spectrochim Acta A Mol Biomol Spectrosc. 2015 Jan 5;134:40-7. doi: 10.1016/j.saa.2014.06.075. Epub 2014 Jun 21. Spectrochim Acta A Mol Biomol Spectrosc. 2015. PMID: 25004893
-
Sonochemical synthesis of highly fluorescent ag nanoclusters.ACS Nano. 2010 Jun 22;4(6):3209-14. doi: 10.1021/nn100987k. ACS Nano. 2010. PMID: 20507161
-
Water-soluble fluorescent silver nanoclusters.Adv Mater. 2010 Mar 12;22(10):1078-82. doi: 10.1002/adma.200904199. Adv Mater. 2010. PMID: 20401932
-
Cytosine-rich ssDNA-templated fluorescent silver and copper/silver nanoclusters: optical properties and sensitive detection for mercury(II).Mikrochim Acta. 2019 Jul 17;186(8):541. doi: 10.1007/s00604-019-3658-4. Mikrochim Acta. 2019. PMID: 31317329
-
Ag K-edge EXAFS analysis of DNA-templated fluorescent silver nanoclusters: insight into the structural origins of emission tuning by DNA sequence variations.J Am Chem Soc. 2011 Aug 10;133(31):11837-9. doi: 10.1021/ja202797w. Epub 2011 Jul 19. J Am Chem Soc. 2011. PMID: 21770404
Cited by
-
Two Photon Induced Luminescence of BSA Protected Gold Clusters.Chem Phys Lett. 2013 Mar 13;561-562:74-76. doi: 10.1016/j.cplett.2013.01.028. Chem Phys Lett. 2013. PMID: 26635417 Free PMC article.
References
Grants and funding
LinkOut - more resources
Full Text Sources