. 1992 Dec;2(4):217-223.
doi: 10.1007/BF00865279.

2-[2-[4-[2-[2-[ 1,3-Dihydro- 1,1-bis (4-hydroxyphenyl)-3-oxo-5-isobenzofuranthioureidyl]ethylaminocarbonyl]ethyl]phenyl] ethylamino]-5'- N-ethylcarboxamidoadenosine (FITC-APEC): A Fluorescent Ligand For A2a-Adenosine Receptors

Affiliations

2-[2-[4-[2-[2-[ 1,3-Dihydro- 1,1-bis (4-hydroxyphenyl)-3-oxo-5-isobenzofuranthioureidyl]ethylaminocarbonyl]ethyl]phenyl] ethylamino]-5'- N-ethylcarboxamidoadenosine (FITC-APEC): A Fluorescent Ligand For A2a-Adenosine Receptors

R Tyler McCabe et al. J Fluoresc. 1992 Dec.

Abstract

The fluorescein conjugate, FITC-APEC (2-[2-[4-[2-[2-[1,3-dihydro-l,l-bis(4-hydroxyphenyl)-3-oxo-5-isobenzofuranthioureidyl]ethylaminocarbonyl]ethyl]phenyl]ethylamino]-5'-N-ethylcarboxamidoadenosine), is a novel ligand derived from a series of functionalized congeners that act as selective A2a-adenosine receptor agonists. The binding of FITC-APEC to bovine striatal A2a,-adenosine receptors measured by fluorescence techniques was saturable and of a high affinity, with a Bmax, of 2.3 ± 0.3 pmol/mg protein and KD of 57 ± 2 nM. The KD value estimated by fluorescence was consistent with the Ki (11 ± 0.3 nM) obtained by competition studies with [3H]CGS 21680. Additionally, the Bmax, value found by FITC-APEC measurement was in agreement with Bmax, values obtained using radioligand binding. FITC-APEC exhibited rapid and reversible binding to bovine striatum. The potencies of chemically diverse A2a-adenosine receptor ligands estimated by inhibition of FITC-APEC binding were in good agreement with their potencies determined using radioligand binding techniques (r = 0.97, P = 0.0003). FITC-APEC binding was not altered by purine derivatives that do not recognize A2a-adenosine receptors. These findings demonstrate that the novel fluorescent ligand FITC-APEC can be used in the quantitative characterization of ligand binding to A2a-adenosine receptors.

Keywords: A2a-adenosine receptors; Fluorescence; bovine striatum; receptor binding.


Figures

Fig. 1
Fig. 1
Synthesis of the fluorescent A2a-adenosine receptor ligand, FITC-APEC.
Fig. 2
Fig. 2
Association and dissociation of FITC-APEC binding to bovine striatal membranes. Tissues were prepared and assayed as described under Materials and Methods. Association of FITC-APEC (50 nM) binding was performed by varying the incubation period (1–130 rain). Equilibrium was attained within 60 rain and maintained throughout the 130-rain duration. A 90-min incubation period was selected for use in subsequent experiments. Association data (■, solid line) represent means (mean % specific binding) from triplicate samples of two separate determinations. The rate constants were estimated using the equation k1 = (kobsk−1/LT, where LT is the total FITC-APEC concentration. The kobs and k1 estimates for FITC-APEC were 0.029 min −1 and 7.47 × 10⁶ M−1 min−1, respectively. Dissociation of bound FITC-APEC was performed as described under Materials and Methods. The dissociation rate constant k−1 was 0.345 min−1 Dissociation data (□, dotted line) represent means (mean % specific binding) from triplicate samples of two separate experiments. The KD determined by nonequilibrium methods (KD = k−1/k1) was 46 nM.
Fig. 3
Fig. 3
Plot of a saturation isotherm constructed from equilibrium saturation data of FITC-APEC binding to bovine striatal membranes. The concentration of FITC-APEC was varied from 16 to 248 nM. Nonspecific binding was defined by the presence of 2-CADO (10 μM). Specific binding of FITC-APEC (50 mM) determined by fluorescence measurement was approximately 20% of the total binding (specific binding of [3H]CGS 21680 (6 nM) was determined to be approximately 50% of total binding). The isotherm is representative of three separate determinations. The KD and Bmax estimates for specific FITC-APEC binding determined using saturation isotherms were (mean ± SE) 57 ± 2 nM and 2.3 ± 0.3 pmol/mg protein, respectively. Data analysis was performed using GraphPAD (ISS Software, San Diego, CA). Inset: Representative Scatchard plot of saturation data.
Fig. 4
Fig. 4
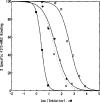
Inhibition of specific FITC-APEC binding by A2a-adenosine receptor ligands. Inhibition of FITC-APEC binding (50 nM) to bovine striatal membranes was assessed as described under Materials and Methods. K1 values for inhibition of FITC-APEC binding in descending order of potency were as follows: NECA, 4.1 ± 0.1 nM (■); DPMA, 13 ± 3 nM (△, dotted line); 2-CADO, 34 ± 14 nM (•); and CV 1808, 131 ± 62 nM (□). Data (mean % specific binding) represent triplicate samples from at least three experiments. The competition curves demonstrate mass action displacement of FITC-APEC binding by the four compounds.
Fig. 5
Fig. 5
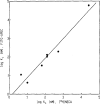
Correlation between the potencies of A2a-adenosine receptor ligands as inhibitors of FITC-APEC and radioligand binding. The K1 (nM) values assessed by inhibition of FITC-APEC binding (ordinate) by A2a-adenosine receptor ligands were related to K1 values found using [3H]NECA binding (abscissa). FITC-APEC inhibition data (means) were obtainted from the values in Fig. 4 and Table I. [3H]NECA inhibition data were from the report by Bruns et al. [23]. The following compounds were used in the graph: NECA, DPMA, 2-CADO, CHA, R-PIA, CV 1808, and theophylline. The correlation coefficient for inhibition of FITC-APEC binding versus [3H]NECA binding was r = 0.97 (P = 0.0003).

Similar articles

Cited by

References

    1. Yamamura HI, Enna SJ, Kuhar MJ. Neuro-transmitter Receptor Binding. Raven Press; New York: 1983.
    1. Snyder SH. JAMA. 1989;261:3126–3129. - PubMed
    1. McCabe RT, de Costa BR, Miller RL, Havunjian RH, Rice KC, Skolnick P. FASEB J. 1990;4:2934–2940. - PubMed
    1. Havunjian RH, de Costa BR, Rice KC, Skolnick P. J. Biol. Chem. 1990;265:22181–22186. - PubMed
    1. McCabe RT, Newman AH, Skolnick P. J. Pharmacol. Exp. Ther. 1992;262:734–740. - PubMed

LinkOut - more resources