. 2013 Jun 18:8:155.
doi: 10.1186/1749-8090-8-155.

ECM-related gene expression profile in vascular smooth muscle cells from human saphenous vein and internal thoracic artery

Affiliations

ECM-related gene expression profile in vascular smooth muscle cells from human saphenous vein and internal thoracic artery

Tian-xiang Zhu et al. J Cardiothorac Surg. .

Abstract

Currently, Saphenous vein (SV) and internal thoracic artery (ITA) are still the most common graft materials in Coronary Artery Bypass Grafting (CABG) whereas SV graft have a lower long-term patency than ITA. Vascular smooth muscle cells (VSMCs) phenotype conversion, proliferation and migration may play a key role in mechanism of vein graft restenosis. To explore differential gene expression profile in VSMCs from SV and ITA will help to further elucidate the mechanism of VSMCs in vein graft restenosis after CABG and to provide new thread of gene therapy.

Methods: VSMCs from paired SV and ITA were cultured for experiments of Affymetrix microarrays and verification using FQ RT-PCR, while the database for annotation, visualization and integrated discovery bioinformatics resources (DAVID 2.0) was utilized for bioinformatics analysis of differential gene expression profile between SV VSMCs and ITA VSMCs. RNA of tunica media from SV and ITA segments were extracted for FQ RT-PCR to display differential expression of PLAT RESULTS: 54,613 probe sets were examined by gene microarray experiments. In SV VSMCs, 1,075 genes were up-regulated and 406 of them were higher than two-fold; 1,399 genes were down-regulated and 424 of them were lower than two-fold as compare with ITA VSMCs.14 ECM-related genes differentially expressed were verificated and listed as following: COL4A4, COL11A1, FN1, TNC, THBS, FBLN, MMP3, MMP9, TIMP3, WNT5A, SGCD were higher whereas COL14A1, ELN, PLAT lower in SV VSMCs than ITA VSMCs. In addition, PLAT was lower in tunica media from SV segments than ITA.

Conclusion: VSMCs from SV and ITA have distinct phenotypes characteristics. Both promoting and inhibiting migration ECM-related genes were higher in VSMCs from SV as compared with ITA, suggesting that VSMCs from SV have more potential migrating capability whereas less PLAT both in SV VSMCs and vascular tissue,implying that SV may prone to be restenosis after CABG.


Figures
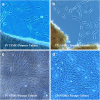
Figure 1
Figure 1
Morphous of SV VSMCs & ITA VSMCs. a). SV VSMCs emigrated from the tissue explant (10 × 10). b). ITA VSMCs emigrated from the tissue explant (10 × 10). c). SV VSMCs grew form a typical “hill and valley” pattern (10 × 5). d). ITA VSMCs grew form a typical “hill and valley” pattern (10 × 5).
Figure 2
Figure 2
Identify SV and ITA VSMCs by immunofluorescence staining (10 × 20). SV VSMCs: a). Control b). DAPI display nucleolusc. c). TRITC display SMα-actin. d). Merge panel. ITA VSMCs: e). Control. f). DAPI display nucleolusc. g). TRITC display SMα-actin. h). Merge panel.
Figure 3
Figure 3
Proliferation assay of VSMCs from SV & ITA using MTT Kit. a). growth curve of SV VSMCs: b). growth curve of ITA VSMCs. P-value: obtained by paired t-test between group PDGF-BB and group DMEM/F12 using SPSS 13.0 (*P < 0.05; ** P < 0.01).
Figure 4
Figure 4
Morphology diversity under distint treated factors (Magnification 10 × 10). SV VSMC: a) DMEM/F12 b) 10%FBS c) 10 ng/ml PDGF-BB. ITA VSMC: d) DMEM/F12 e) 10%FBS f) 10 ng/ml PDGF-BB. a) and d): Cells grew with long and thin shape, refractive index of the cell edge increased. Cells line more compactly, and gradually formed a multil-overlapping, bundles, polarity, similar to the organic assembled VSMCs of the blood vessel wall. b) and e): Cells grew with typical "hill and valley" pattern, from multil-overlapping and non-cell regions. c) and f): Polarity of the cells disappeared, and proliferation were enhanced,form many ultra-overlapping regions.
Figure 5
Figure 5
Scatter graph of microarray analysis of gene expression. Fold change Line from diagonal to two side represent 2,3,10,30 fold respectively. Yellow color: Low expression in VSMCs both ITA & SV. Red color: High expression in VSMCs both ITA & SV. Blue color: Differential expression in VSMCs from ITA & SV.
Figure 6
Figure 6
GO terms cluster of up-regulated and down-regulated genes in SV VSMCs.Fold Enrichment (FE): To measure the magnitude of enrichment. For example, 10% of analysis genes are kinases versus 1% of genes in human genome (this is population background) are kinases. Thus, the fold enrichment is tenfold. Fold enrichment 1.5 and above are considered as statistical significance. Negative value means that the GO term was down-regulated in SV VSMCs. GO Terms: A detailed GO item in the annotation source of DAVID system. Each set of color bars represents a annotation term group(cluster). Values in brackets was Enrichment Score (ES) of each cluster : To rank overall importance (enrichment) of annotation term groups. It is the geometric mean of all the enrichment P-values (EASE scores) of each annotation term in the group. To emphasize that the geometric mean is a relative score instead of an absolute P-value, minus log transformation is applied on the average P-values. ES > 1.3-fold (equivalent to non-log scale 0.05) was considered as statistical significance, mean that the gene cluster was significantly enriched in analysis list. P-value (or called EASE score, for individual term members): To examine the significance of gene–term enrichment with a modified Fisher’s exact test (EASE score). P <0.05 was considered as statistical significance.
Figure 7
Figure 7
14 ECM- related gene expression profile of VSMCs from SV and ITA. Differential Folds: The median ratio of gene expression in VSMCs from SV and ITA. Negative value mean that the gene was down-regulated in VSMCs from SV as comparing with ITA.
Figure 8
Figure 8
Differential expression of 14 ECM-related Genes of VSMC from SV and ITA (n = 12) (FQ RT-PCR). Differential Folds: The median ratio of gene expression in VSMCs from SV and ITA. Negative value mean that the gene was down-regulated in VSMCs from SV as comparing with ITA. (* P < 0.05; ** P < 0.01).
Figure 9
Figure 9
PLAT was differentially expressed in VSMCs and vessel segment of SV and ITA (FQ RT-PCR). Differential Folds: The median ratio of gene expression in VSMCs from SV and ITA. Negative value mean that the gene was down-regulated in VSMCs from SV as comparing with ITA. PLAT i: from 21 SV and 13 ITA segments; PLAT p: from 12 paired SV and ITA segments. (** P < 0.001; * P = 0.028).

Similar articles

Cited by

References

    1. Cameron A, Davis KB, Green G, Schaff HV. Coronary bypass surgery with internal thoracic-artery grafts: effects on survival over a 15-year period. N Engl J Med. 1996;334:216–219. doi: 10.1056/NEJM199601253340402. - DOI - PubMed
    1. Lüscher TF, Turina M, Braunwald E. Coronary Artery Graft Disease. Berlin and Heidelberg GmbH: Springer Verlag; 1994.
    1. Mitra AK, Gangahar DM, Agrawal DK. Cellular, molecular and immunological mechanisms in the pathophysiology of vein graft intimal hyperplasia. Immunol Cell Biol. 2006;84(2):115–124. doi: 10.1111/j.1440-1711.2005.01407.x. - DOI - PubMed
    1. Jia G, Cheng G, Agrawal DK. Differential effects of insulin-like growth factor-1 and atheroma-associated cytokines on cell proliferation and apoptosis in plaque smooth muscle cells of symptomatic and asymptomatic patients with carotid stenosis. Immunol Cell Biol. 2006;84:422. doi: 10.1111/j.1440-1711.2006.01449.x. - DOI - PubMed
    1. Yang Z, Oemar BS, Carrel T, Kipfer B, Julmy F, Lüscher TF. Different proliferative properties of smooth muscle cells of human arterial and venous bypass vessels: role of PDGF receptors, mitogen-activated protein kinase, and cyclin-dependent kinase inhibitors. Circulation. 1998;97(2):181–187. doi: 10.1161/01.CIR.97.2.181. - DOI - PubMed

Publication types